Download
1 / 21
210 likes | 315 Views
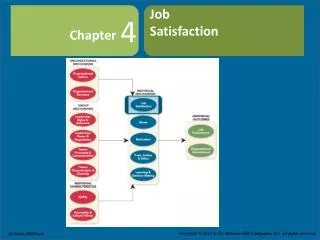
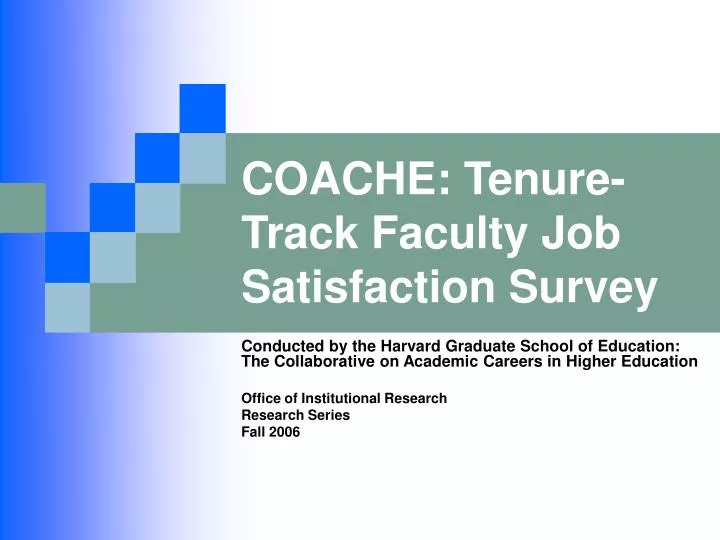
COACHE: Tenure-Track Faculty Job Satisfaction Survey. Conducted by the Harvard Graduate School of Education: The Collaborative on Academic Careers in Higher Education Office of Institutional Research Research Series Fall 2006. Theoretical framework. Sociological/generational theory

E N D
COACHE: Tenure-Track Faculty Job Satisfaction Survey Conducted by the Harvard Graduate School of Education: The Collaborative on Academic Careers in Higher Education Office of Institutional Research Research Series Fall 2006
Theoretical framework • Sociological/generational theory • Generation-X • Born between 1965-1980 • Skeptical • Believe parents suffered from VDD- vacation deficit disorder • Willing to work hard but wants to decide when, where and how
Purpose of the COACHE study • Make the academy a more equitable and appealing place for new faculty to work in order to recruit and maintain top talent • Increase the recruitment, retention, status, success and satisfaction of faculty of color • Give voice to early career faculty • Produce structural and cultural changes on campuses
COACHE themes • Importance and effectiveness of policies • Tenure clarity and reasonableness of expectations • Work load and environment • Climate, culture collegiality and support • Global satisfaction
Survey design and analysis • Survey design and questions based on focus group research using a sociological/generational framework • Survey conducted and analysis provided through Harvard Graduate School of Education • Comparisons within school (overall, female and minority) and between school and peers • Significant results + or – more than one standard deviation from the mean
Statistical briefs • 118 faculty invited to participate • 59.3% completion rate • Slightly higher than national rate of 56% • Within UNC • Greatest UNC-Asheville at 83.3% • Smallest Winston-Salem State at 33.3%
Visual measurement approach • UNCW mean compared with peer mean overall and by sub-groupings (gender and ethnicity) • Peers selected by GA were ASU, FSU, NCCU, UNC-P, WCU • Slide for each group of questions by theme and mean comparisons are noted as follows: • UNCW mean and (peer mean) included in each cell when available UNCW mean was more than one standard deviation above the comparison group mean UNCW mean was more than one standard deviation below the comparison group mean
Example: 5-point scale 5-very satisfied to 1-very unsatisfied
Example: 5-point scale 5-very satisfied to 1-very unsatisfied
Example: 5-point scale 5-very effective to 1-very ineffective
Top five best and worst aspects about working at UNCW Best Worst
Geographic location Average 1.78 (14 schools) My sense of ‘fit’ here Average 2.07 (14 schools) Diversity Average 2.7 (6 schools) Quality of colleagues Average 3.4 (10 schools) Support of colleagues Average 3.5 (10 schools) Compensation Average 2 (14 schools) Teaching load Average 2.25 (12 schools) Lack of support for research Average 2.8 (15 schools) Quality of UG students Average 3 (11 schools) Too much service/too many assignments Average 4.44 (9 schools) Best and Worst across UNC Best Worst
What can we learn? • How does UNCW compare to its peers? • Are there significant differences by demographic category? • Are there areas where we do especially well? Not as well? • What changes in policy or practice could we consider to positively impact these results?