Download
1 / 20
200 likes | 336 Views
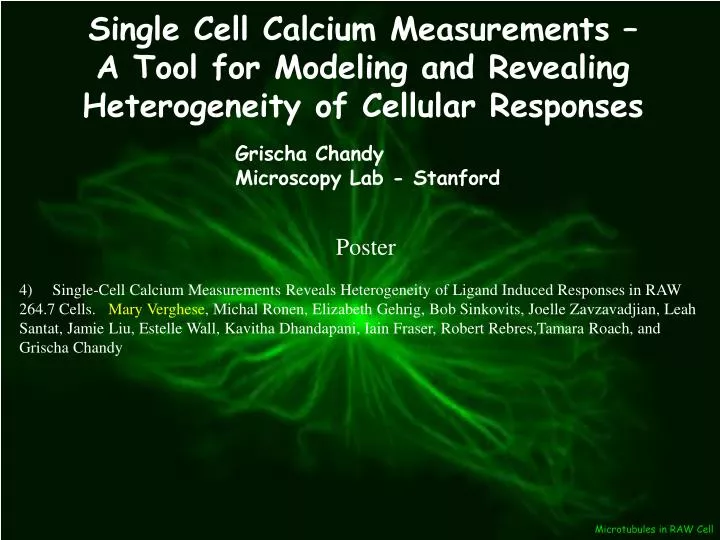
Single Cell Calcium Measurements – A Tool for Modeling and Revealing Heterogeneity of Cellular Responses. Grischa Chandy Microscopy Lab - Stanford. Poster

E N D
Single Cell Calcium Measurements – A Tool for Modeling and Revealing Heterogeneity of Cellular Responses Grischa Chandy Microscopy Lab - Stanford Poster 4) Single-Cell Calcium Measurements Reveals Heterogeneity of Ligand Induced Responses in RAW 264.7 Cells. Mary Verghese, Michal Ronen, Elizabeth Gehrig, Bob Sinkovits, Joelle Zavzavadjian, Leah Santat, Jamie Liu, Estelle Wall, Kavitha Dhandapani, Iain Fraser, Robert Rebres,Tamara Roach, and Grischa Chandy Microtubules in RAW Cell
Experimental protocol and time course Fura-2 Loaded Cells On Microscope 340 and 380 nm excitation Sample 1/ second 510 nm emission 340/380 Ratio
Experimental protocol and time course 340/380 Ratio Automatic cell detection
Experimental protocol and time course Basal = average between 5 and 35 seconds Peak = max between ligand and 300 seconds Stores release • Sustained = max between 240 and 480 or 600 seconds • Secondary Responses Thaps, Iono, EGTA Manual ligand addition. Ligand is added 60 seconds after start of recording
Experimental Analysis Responding Cells Overlap [Ca2+]i nM % of cells Fold (Peak/Basal) Time (s) Gross Analysis - Average response - % Cells that respond > 2 fold peak/basal -Slope based identification is more sensitive - Histogram of Delta (Peak – Basal) - % of cells that had secondary activity - Ionomycin / Thapsigargin peak (Ca2+ store size) Many other features all with frequency distributions Delay times, rise times, decay rates, sustained levels, shape of primary and secondary peaks, more
Dose Response Curves % of cells > 2 fold Average [Ca2+]Amplitude Buffer Log ([UDP] M) D Average [Ca2+] nM Time (s) • Linear range of UDP dose response % of cells responding is between 1-100 nM (EC50% ~3 nM) • Linear range of average response is between 3 and 1000 nM (EC50% ~80 nM). • Similar to macrophage labs reported value of 200 nM • C5a has similar EC50% for activating delta Ca2+ and % of cells responding (Data on poster).
[Ca2+] nM [Ca2+] nM Time (s) Time (s) Oscillating Cells Averages and Examples of Single Cell Responses 2 mM EGTA 300 nM C5a 10 nM UDP • Found with lower doses of UDP (10-30% vs 0-1%) • Secondary responses are present in the absence of [Ca2+]o • Higher doses of C5a in the absence of extracellular Ca2+ • Secondary responses continue in the absence of [Ca2+]o
Relationship Between Initial Response and Store Depletion UDP (N>2400) C5a (N>2300) Pertubation? Store [Ca2+] nM Store [Ca2+] nM D Ca2+ nM D Ca2+ nM Average [Ca2+] nM Time (s) Ca2+ 10 mM UDP +/- EGTA
RNAi Perturbants Lentiviral Transduced shRNA Expressing Cells 3 Examples
Gaq 80% KD Average[Ca2+] nM Average[Ca2+] nM Time (s) Time (s) UGI2P_Inf13 Grk2_Inf13 Gq_Inf13 75 50 37 IB: Gaq 100 nM UDP 10 nM UDP 70% KD 78% KD % of Cells Mol. Bio. Lab D [Ca2+] Amplitude
Average[Ca2+] nM Average[Ca2+] nM Time (s) Time (s) Gaq - Examples of Single Cell Traces. 100 nM UDP 10 nM UDP • Though there is robust KD of Gq. Significant fraction of cells still have robust response to 100 nM UDP • Low Levels of Gaq are sufficient for signaling • Alternate pathways (Ga11) • Other more complicated scenarios
Gai2 – 10 nM UDP PTEN control UGIP Control Gi3_shRNA Gi2_shRNA IB: G alpha i2 3 fold enhancement 3 fold enhancement D Average [Ca2+] D Average [Ca2+] % of Cells Time (s) D [Ca2+] Amplitude • Increase response of Ga2 knockdown cells readily apparent with 10 nM UDP but not seen with 1 uM. Mol. Bio. Lab
Lots of secondary peaks and oscillating cells Arrestin3 – 100 nM C5a Control Arr3 Gb5 49 38 IB: Arr3 Mol. Bio. Lab
Summary of Lentiviral mediated RNAi C5a UDP or UTP‡ Single Pop. Single Pop. • Calls and values based on Delta calcium and % of cells responding being more than 20% +/- of control Population Response Thresholds Elevated = >1.5 No change = 0.7-1.4 Decreased = <0.7 * = p<0.05 Single Cell Confidence Level - = or + = one dose or data set 0 no change -- or ++ = >1 dose or data set
Correlation between D Calcium and % responding All experiments pooled. P2Y2 10 nM, Gai2 Arr3 10 nM, Vector Control • Average increased response due to increased response in each cell • Influx?? • Average increased response due to additional cells being activated
Calcium dynamics - Hypothesis C5a or UDP G PLC PIP2 R DAG Arrestin IP3 Ca2+ PKC Oscillations CCE/SOC Na/Ca Exchanger IP3R Ca2+ ER ATPase
Calcium dynamics - Hypothesis UDP G PLC PIP2 R DAG Arrestin IP3 Ca2+ PKC Sustained Ca2+ CCE/SOC Na/Ca Exchanger IP3R ER Ca2+ ATPase
Summary • Cells are heterogeneous • Single cells information is very different from averages • Possible differential dose dependent effects • Unexpected shRNA phenotypes with low dose UDP • We can provide detailed single cell data that can be used to constrain Ca2+ model (influx, efflux rates, frequency). • Verification Needed • More experiments needed on controls – Error • Other perturbations (direct use of duplex, dominant negative and WT cDNAs)
Mary Verghese– Performed all experiments, ~200 uploaded to UCSD Liz Gehrig Nancy O’Rourke Tobias Meyer Michal Ronen – Data Analysis Bob Sinkovits – Bioinformatics Lab Molecular Biology Lab Macrophage Lab