Download
1 / 37
370 likes | 437 Views
Rising to Depletion ?. Towards a dialogue on the state of national marine fisheries. A PROFISH Preliminary Report presented to the World Bank on 26 May 2009. Outline. Introduction The approach The data Selected results Discussion Conclusions. 1. Introduction The study backdrop.

E N D
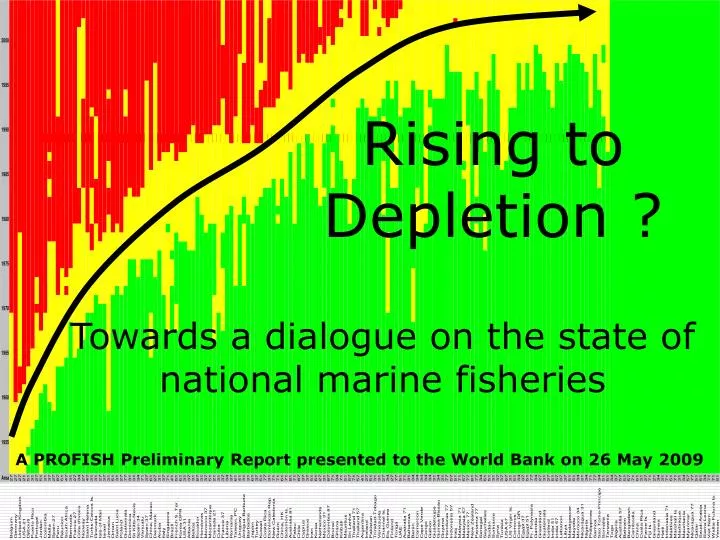
Rising to Depletion ? Towards a dialogue on the state of national marine fisheries A PROFISH Preliminary Report presented to the World Bank on 26 May 2009
Outline • Introduction • The approach • The data • Selected results • Discussion • Conclusions
1. IntroductionThe study backdrop • 90% of stocks are under national jurisdiction and the large majority is under excessive pressure • Countries are responsible and committed to restore stocks by 2015 (WSSD POI) but progress is very slow • At global level, information on stocks is often scarce, fragmented, too slowly updated and often outdated • There is therefore no regularly updated and easily accessible indicator of fishery development level at national, regional or global level
1. IntroductionThe study outcome • An approach providing a simple, generally available and effective entry point into an interactive fishery reform process • The approach is scalable, at sub-sectoral, sectoral, national, regional or global levels • It may encourage countries to: • Build on their existing efforts, making better use of available statistics • Improve the quality of their statistics formalizing their use as indicators and • Publicly account for the health of their fishery resources
Max landing Max growth Zero growth 0 I II III IV V Undev. Developing Mature Senescent Recovering 2. Approach The development cycle Aggregate landings Relative growth rate Time
Max landing Max growth II I III V IV 2. ApproachThe phase graph Growth rate Zero growth 0 Landings
2. ApproachThe development cycle I II III IV V Landings ( ) Landings 0 Time II Growth rate V I III 0 IV Landings
III III III IV? II IV IV III IV II I 2. ApproachThe development cycle Growth Rate or landings 0 Time
Fluctuation loops II I III V? IV 2. ApproachThe phase graph Growth rate 0 Landings
Country A Country A Country B Country B Home Area B Home Area A Home Area B Home Area A Offshore resources limit Long-range fleets grounds Offshore resources limit Limit of the FAO Area Limit of the FAO Area 2. ApproachFAO Areas and Home Areas
3. Data • FAO FISHSTAT+ landings database • Marine capture fisheries 1950-2006 in Home Areas • 5 taxonomic categories • Total Fishes • Bottom Fishes • Small Pelagic Fishes • Other Fishes • Crustaceans • 3 indicators (raw and smoothed) • Reported landings • Annual relative rates of increase • Annual landing ratio (Lt/Lmax)
4. Selected results • Typical patterns • World level diagnostic • Regional level diagnostic • National level diagnostic • Other observations
4aTypical patterns World-Total Belgium-Total Denmark-Total
Albania-Total Fishes Albania-Total 50 30 9000 20 40 8000 10 30 7000 0 20 6000 -10 10 5000 ROI (%) -20 0 ROI (%) 4000 -30 Landings (Tonnes) -10 -40 3000 -20 -50 2000 -30 -60 1000 -40 0 2.000 4.000 6.000 8.000 -50 0 Landings (tonnes) 1950 1960 1970 1980 1990 2000 4a. Typical patternsAlbania - Total
4bWorld level Total Fishes Bottom Fishes Pelagic Fishes
4bWorld Level Other Fishes Crustaceans Cephalopods
4cRegional Level Area 21-Total Area 27-Total Area 31-Total
4. Colour coding Developing Mature Senescent LMax 100 90 75 % of LMAX 50 I II III IV 0 Time
Developing: Indonesia 77 Developing t) t) 3 20 70 30 6 3 60 2,5 15 20 50 2 10 40 ROI (%) ROI (%) 1,5 5 10 Landings (10 Landings (10 30 1 0 20 0 0,5 -5 10 0 -10 0 -10 1950 1960 1970 1980 1990 2000 1950 1960 1970 1980 1990 2000 Mature t) 70 30 70 30 3 60 60 20 20 50 50 40 40 ROI (%) ROI (%) 10 10 Landings (10 30 30 20 20 0 0 10 10 0 -10 0 -10 1950 1960 1970 1980 1990 2000 1950 1960 1970 1980 1990 2000 4d. National levelTypes of patterns Mature: Cameroon t) 3 Landings (10
Senescent (1): Singapore Senescent 1 t) 20,0 30 70 30 t) 3 60 3 20 15,0 20 50 10 40 ROI5 (%) ROI (%) 10,0 0 10 Landings5 (10 30 Landings (10 -10 20 5,0 0 -20 10 0,0 -30 0 -10 1950 1960 1970 1980 1990 2000 1950 1960 1970 1980 1990 2000 Senescent 2): Belgium Senescent (2) t) 70 10 70 30 t) 3 60 60 3 5 20 50 50 40 40 ROI5 (%) 0 ROI (%) 10 30 Landings5 (10 Landings (10 30 20 -5 20 0 10 10 0 -10 0 -10 1950 1960 1970 1980 1990 2000 1950 1960 1970 1980 1990 2000 4d. National levelTypes of patterns
Indeterminate t) 70 30 3 60 20 50 40 ROI (%) 10 Landings (10 30 20 0 10 0 -10 1950 1960 1970 1980 1990 2000 4d. National levelTypes of patterns
4d. National levelSummary diagnostic *Note: countries bordering more than one FAO Area are counted more than once
4d. National levelRising to depletion? Total Fishes Bottom Fishes Home areas Home areas 1952 2004 1952 2004
4dNational level % in development phases
Tanzania - Total 30 Growth 20 10 ROI5 (%) 0 -10 Stabilization? -20 0 10 20 30 40 50 3 Landings5 (10 t) 4e. Other observationsOscillations Environment or business cycles?
4e. Other observationsPattern similarities Data manipulations or large scale environmental signals?
Ind. war 1961-74 4e. Other observationsAbnormal patterns
Rising 0 Depletion 5. ConclusionThe title to As the aggregated level of saturation of the sector is reached, the risk of depletion increases
5. ConclusionThe bottom line • Countries are responsible for meeting their WSSD commitments • A robust country-level indicator on the state of the sector would help counties assess their progress and inform society • Existing statistics offer a possibility to be fully examined. They are underused and could be improved • Countries can improve on this first proposal through their own efforts. The Bank could help. • Country reporting to FAO would also be improved
5.ConclusionsWhat next regarding the study? • Continue peer review • Complete the analyses by resource types • Case studies (West Africa)
5Conclusions Senegal (left) Ghana (right)
5. ConclusionsWhat next regarding cases studies ? • Identify partner countries : normal, abnormal • Check sensitivity to drivers: • Integrate stock-specific and sector-wide analyses • Integrate development and management • Combine with sector-level economic analysis
Recovery 1950-2006 Future Demise 1950-2006 Future Towards what future? Many thanks for your attention