Download
1 / 7
80 likes | 180 Views
SCIENCE GRAPH. Science graph. By :CARLA MACURI AND ADRIANA ESCALAYA. FIRST BOTTLE. First bottle with cold water with salt was started. Water and oil was added. T he oil was on top. The oil was spreading around while the salt was at the bottom of the water.

E N D
SCIENCE GRAPH Science graph By :CARLA MACURI AND ADRIANA ESCALAYA
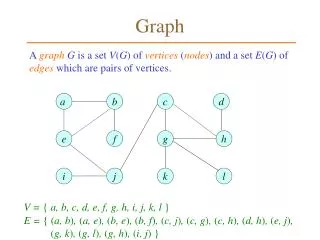
FIRST BOTTLE • First bottle with cold water with salt was started. Water and oil was added. The oil was on top. • The oil was spreading around while the salt was at the bottom of the water. • The oil was starting to go down and separating with the water. • The oil half is on the top the food coloring is mixing with the water (11 drops of food coloring).
FIRST BOTTLE • The half of the alka-seltzer was added to the bottle • Its stating to make blobs and more blobs. • The bottle was closed and set to watch.
SECOND BOTTLE • Second bottle got started. cold water and oil was put into the bottle. • The oil and the water were just about to separate. • It was still in process.
Secondbottle • The water and oil are still separating. • The have separated, and its on a slow watch. • 12 drops of food coloring was added to the water bottle. And started to change.
SECOND BOTTLE • Half of the alka-seltzer was added to the water bottle. • It started to make big blobs and in a fast speed. • The project was finished we only watched move around.