Download

1 / 10
100 likes | 120 Views
BEADS is a method developed at the University of Cambridge to correct biases in deep sequencing data, particularly in ChIP-seq analysis for genomic DNA. The algorithm addresses tag count variations, GC content, mappability differences, and local effects to ensure accurate peak calling and signal plotting across features.

E N D
BEADS: Bias Elimination Algorithm for Deep Sequencing NICOLE CHEUNG, THOMAS DOWN, JULIE AHRINGER The Gurdon Institute University of Cambridge, Cambridge UK
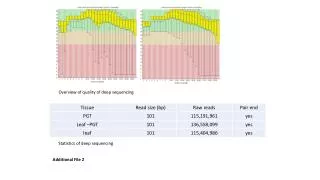
Bias in deep sequencing data: Tag counts for C. elegans genomic DNA and ChIP input sequence are not uniform (tag count biases also observed in human ChIP input sequence (Rozowsky et al 2009)) • Analysis of ChIP seq data needs to take bias into account: • Peak calling • Input sequence is used for significance scoring of peaks • But only regions enriched in ChIP are processed. • (e.g, MACS, PeakSeq, SPP, …) • Plotting signal across features (e.g, TSS, exons, …) • Need a method to correct signal at all positions
Patterns correlate with GC content and mappability differences Low read counts in regions of low mappability Genomic and input DNA patterns are similar to GC content track
GC rich sequences are over-represented %GC input sequence % GC genome Low % GC is under-represented High % GC is over-represented 0 10 20 30 40 50 60 70 80 % GC
Patterns of %GC, mappability, and ChIP input sequence across C. elegans exons and promoters EXONS TSSs 500 bp intron >100 bp 500 bp intron % GC Mappability Raw input sequence Peaks in TSSs of human genes observed by Rozowsky et al 2009 PeakSeq paper)
Normalization strategy • 1) G+C count normalization • Apply on every read • 2) Mappability correction • Apply on each genomic location • 3) Residual local effect, e.g. DNA accessibility - correct using information from input
Three step normalization removes bias in ChIP input sequence EXONS TSSs 500 bp intron 500 bp intron >100 bp Correction applied: raw GC GC + map Signal across exons and TSSs is flat in ChIP Input sequence after correction GC + map + local
H3K4me3 previous knowledge: peaks in promoter regions TSSs EXONS 500 bp intron 500 bp intron >100 bp Correction applied: raw GC GC + map Expected promoter peaks remain after normalization Exon peaks removed after normalization GC + map + local
H3K36me3 previous knowledge: on transcribed regions, enriched in exons TSSs EXONS 500 bp intron 500 bp intron >100 bp Correction applied: raw GC GC + map H3K36me3 signal on gene body H3K36me3 enrichment on exons GC + map + local