Download
1 / 5
50 likes | 203 Views
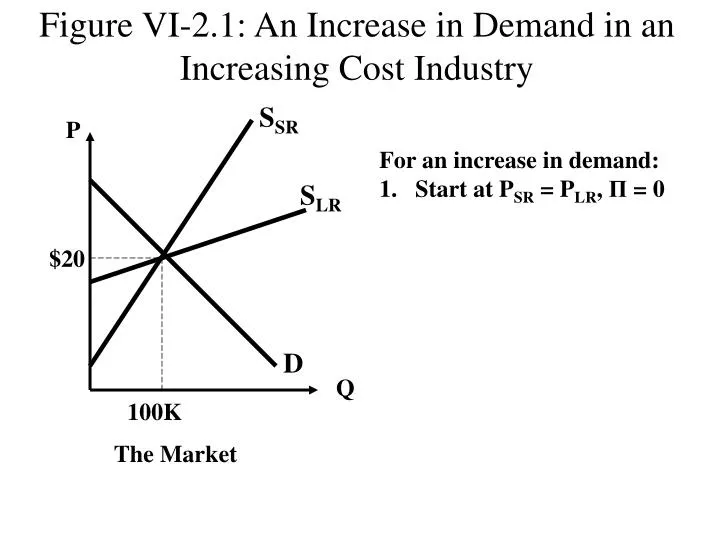
Figure VI-2.1: An Increase in Demand in an Increasing Cost Industry. S SR. P. For an increase in demand: Start at P SR = P LR , Π = 0. S LR. $20. D. Q. 100K. The Market. Figure VI-2.2: An Increase in Demand in an Increasing Cost Industry. S SR. P. For an increase in demand:

E N D
Figure VI-2.1: An Increase in Demand in an Increasing Cost Industry SSR P • For an increase in demand: • Start at PSR = PLR, Π = 0 SLR $20 D Q 100K The Market
Figure VI-2.2: An Increase in Demand in an Increasing Cost Industry SSR P • For an increase in demand: • Start at PSR = PLR, Π = 0 • Increase demand • PSR > PLR, Π > 0 causes entry. SLR $35 $20 D’ D Q 100K 105K The Market
Figure VI-2.3: An Increase in Demand in an Increasing Cost Industry SSR • For an increase in demand: • Start at PSR = PLR, Π = 0 • Increase demand (Subsidy) • PSR > PLR, Π > 0 causes entry. • Entry causes S to increase. • 5. So costs to increase and • P decreases until PSR = PLRand Π = 0 (back in LR equilibrium). P S’SR SLR $35 $30 $20 D’ D Q 100K 105K110K The Market
Figure VI-2.6: A Decrease in Supply in an Increasing Cost Industry with Legal Entry Barriers S’SR SSR P • For a decrease in supply: • Start at PSR = PLR, Π = 0 • Short-run S decreases producing Π > 0. • Entry barrier prevents S from increasing. SLR $30 $20 D Q 80K 100K The Market
Explanation of Figure VI-2.6 • (1) Market is in LR equilibrium /Social Welfare Maximum • (2) An decrease in market supply occurs because entry barrier imposed. • (3) Decreased supply causes an increase in the market price which creates positive profits (P > PLR). • (4) Positive profits would cause new entry but new entry cannot occur because of the legal entry barriers. These legal entry barriers create a Welfare Loss