Download
1 / 34
340 likes | 354 Views
Explore soil mapping, functions, threats, and the nitrate problem. Understand complex nitrogen dynamics in soils and the impacts of agricultural practices. Utilize mapping and modeling on different scales and approaches.

E N D
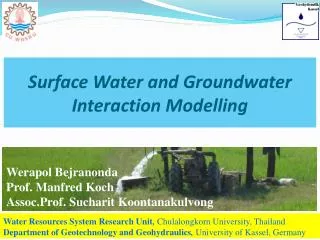
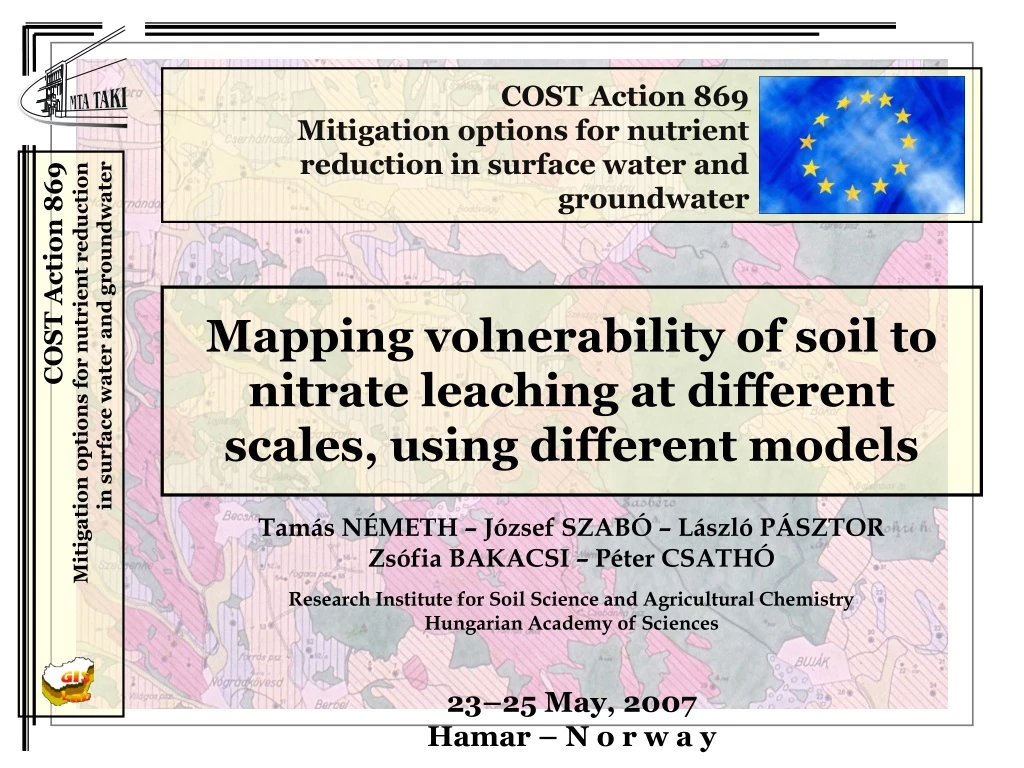
COST Action 869 Mitigation options for nutrient reduction in surface water and groundwater Mapping volnerability of soil to nitrate leaching at different scales, using different models COST Action 869 Mitigation options for nutrient reduction in surface water and groundwater Tamás NÉMETH – József SZABÓ – László PÁSZTOR Zsófia BAKACSI – Péter CSATHÓ Research Institute for Soil Science and Agricultural Chemistry Hungarian Academy of Sciences 23–25 May, 2007 Hamar – N o r w a y
Soil Mapping Soil map can display (i) primary soil properties or soil classes; (ii) secondary soil properties, derived from primary properties; (iii) soil function and/or threats inferred from soil properties and external data. COST Action 869 Mitigation options for nutrient reduction in surface water and groundwater
Soil Mapping Soil map with primary soil properties or soil classes specific spatial inference for the spatial extension of measured/observed data traditional maps with soil mapping units COST Action 869 Mitigation options for nutrient reduction in surface water and groundwater soil survey
Soil Mapping Soil map with secondary soil properties specific spatial inference for the spatial extension of measured/observed data and property inference in the form of pedotransfer rules or environmental models COST Action 869 Mitigation options for nutrient reduction in surface water and groundwater soil survey
Soil Mapping Soil map depicting soil function and/or threat regionalisation of soil related features in the context of soil functions and or degradation processes property inference in the form of environmental models COST Action 869 Mitigation options for nutrient reduction in surface water and groundwater primary soil maps secondary soil maps environmental factors soil survey
Soil Mapping Soil functions* • Food and other biomass production; • Environmental interaction: storage, filtering, and transformation; • Biological habitat and gene pool; • Platform for man-made structures as buildings, roads etc.; • Source of raw materials; • Cultural heritage. COST Action 869 Mitigation options for nutrient reduction in surface water and groundwater *only the six key functions are listed
Soil Mapping Soil threats Soil Framework Directive Compaction Erosion Landslides Salinisation Organic matter decline COST Action 869 Mitigation options for nutrient reduction in surface water and groundwater Sealing Contamination Acidification Waterlogging
Soil Mapping Functional soil mapping • functional soil maps (FSM) regionalises specific soil functions and/or threats; • functional soil mapping produces FSM, based on digital soil mapping (DSM) methods. COST Action 869 Mitigation options for nutrient reduction in surface water and groundwater
Nitrate Problem • nitrate is the most widespread contaminant of groundwater; • its loading is still an unsolved environmental problem; • diffuse input by the rural economy is the main cause of this loading. COST Action 869 Mitigation options for nutrient reduction in surface water and groundwater
NO3-N concentration (mg/kg) Depth (m) Nitrate Problem NO3-N content in soil profile (150 kg/ha dose treatment) Hungary, Nagyhörcsök, Calcaeorus Chernozem Soil COST Action 869 Mitigation options for nutrient reduction in surface water and groundwater Groundwater under 12-13 meters
Nitrate Problem Nitrates Directive* • identification of nitrate polluted waters and; • vulnerable zones; • establishment and imple-mentation of action programmes. COST Action 869 Mitigation options for nutrient reduction in surface water and groundwater groundwaters with nitrate concentrations > 50mg/l if preventative action is not taken Nitrate Vulnerable Zones(NVZ) *Council Directive 91/676/EEC concerning the Protection of Waters against Pollution caused by Nitrates from Agricultural Sources
Nitrate Problem Nitrogen cycle is a complicated system, since N is an ingredient of numerous organic and inorganic chemical compounds with complex transformation and transfer processes. COST Action 869 Mitigation options for nutrient reduction in surface water and groundwater
Nitrate Problem The nitrogen dynamics in soils and the processes which lead to leaching are very complex. Thus it is generally difficult to quantify theenvironmental impacts from agricultural practices. COST Action 869 Mitigation options for nutrient reduction in surface water and groundwater
Nitrate Problem Mapping modelling • on various (from global to local) scales; • using simple or complex; • static or dynamic; • deterministic or stochastic approach. COST Action 869 Mitigation options for nutrient reduction in surface water and groundwater
Nitrate Problem Substantial, detailed methods: necessity of information concerning the spatial distribution of numerous input parameters and the cost of associated measurement campaigns Simpler environmental models: produce results quickly; for overview studies might prove to be sufficient and at the same time more economic;considers the dominant processes operating in the area of interest COST Action 869 Mitigation options for nutrient reduction in surface water and groundwater
Nitrate Problem • Complex dynamic models do not necessarily produce better results than much simpler and partly lumped models. • The reasons for the disappointing results of distributed models can be attributed to the uncertainty involved in estimating and measuring the large number of input variables. • There is also need for much simpler environmental inference models simulating only the dominant processes operating in the area of interest. COST Action 869 Mitigation options for nutrient reduction in surface water and groundwater
Nitrate Problem Identifications of Nitrate Vulnerable Zones* COST Action 869 Mitigation options for nutrient reduction in surface water and groundwater watershed delineation … soil’s nitrate filtering function functional soil mapping DEM analysis e.g. DEFRA (UK) *Member State responsability
Mapping nitrate vulnerability Nitrate Vulnerable Zones spatial data on specific envi-ronmental factors* spatial data on soil inference model functional soil mapping COST Action 869 Mitigation options for nutrient reduction in surface water and groundwater *climate, terrain, groundwater, land use etc. map of potential nitrate leaching areas with higher risk of N-leaching
Mapping nitrate vulnerability • GIS based mapping of soil vulnerability is composed of a hierarchical structure of models and the final map is a result of subsequent model selections. • On the first level the influencing factors are identified: ’which environmental parameters determine the given vulnerability feature?’ • On the second level the available data on the formerly selected parameters are identified: ’what kind of datum is measured and/or available at all on the given influencing parameter?’ • On the third level some derived factors may be calculated: ’may the input data be converted/transformed into more appropriate format?’ • On the forth level the mathematical model is set up: ’what is the functional relation between the vulnerability feature and the determining factors?’ • On the further levels the refinement of the mathematical model takes place: ’which value should be assigned to the parameters to get good/better/the best result?’ • This procedure induces a model family. In this context compilation of the vulnerability map is the result of iteration where data characteristics and model parameters are in interaction. COST Action 869 Mitigation options for nutrient reduction in surface water and groundwater
Mapping nitrate vulnerability National scale approach Simple inference model withfew but really dominant environmental factors Physico-chemical characteristics of soils representing their buffer capacity/resistance feature according to the transfer of pollution COST Action 869 Mitigation options for nutrient reduction in surface water and groundwater
Mapping nitrate vulnerability National scale approach Precipitation surplus induces nitrate pollution to move downwards COST Action 869 Mitigation options for nutrient reduction in surface water and groundwater
Mapping nitrate vulnerability National scale approach Depth of groundwater table determines the distance to be done by nitrate to reach the water body COST Action 869 Mitigation options for nutrient reduction in surface water and groundwater
Csepel Isle Watershed of Tetves Creek physiography plain, island hilly, catchment area 248 km2 120 km2 dominant land use arable land forest, pasture soil information PemeTIR database DKDIS groundwater information detailed, available incomplete, derived precipitation information poor poor Mapping nitrate vulnerability Regional scale approach COST Action 869 Mitigation options for nutrient reduction in surface water and groundwater
Mapping nitrate vulnerability Regional scale approach Using general linear model: 4 V= wi*Fi i=1 Where: V is the measure of vulnerability, Fi is the ith factor and wi is its corresponding weight COST Action 869 Mitigation options for nutrient reduction in surface water and groundwater
Mapping nitrate vulnerability Zonalization/regionalization of the vulnerability categories • The derived vulnerability values are numerical, but they do not represent physical values; • The minimum and maximum values can be interpreted on a relative scale and neither in the case of the two pilot areas can be compared; • There are no reference data, which could be used for transformation of these values to physical values; • There are no threshold values for the different measures of vulnerability. COST Action 869 Mitigation options for nutrient reduction in surface water and groundwater
Mapping nitrate vulnerability Zonalization/regionalization of the vulnerability categories COST Action 869 Mitigation options for nutrient reduction in surface water and groundwater Parametric cluster analysis inthefactor space after overlaying
Mapping nitrate vulnerability Zonalization/regionalization of the vulnerability categories Choosing optimum and parsimonious model information theoretic criteria provide optimum classification Akaike's Information Criterion (AIC): AIC=-2ln(maximum likelihood)+2(# of parameters) Its estimate can be computed by, AIC(estimated)=nln(R)+2p COST Action 869 Mitigation options for nutrient reduction in surface water and groundwater
Mapping nitrate vulnerability Output map: Vulnerability of Hungarian soils to N-leaching COST Action 869 Mitigation options for nutrient reduction in surface water and groundwater
Mapping nitrate vulnerability COST Action 869 Mitigation options for nutrient reduction in surface water and groundwater
Mapping nitrate vulnerability Recent activities Revision of NVZ in Hungary COST Action 869 Mitigation options for nutrient reduction in surface water and groundwater Recompilation of the N-leaching hazard map Comparison of measurements and assigned areas Fitting NVZ boundaries to physical blocks
Mapping nitrate vulnerability Comparison of measurements and assigned areas COST Action 869 Mitigation options for nutrient reduction in surface water and groundwater
Mapping nitrate vulnerability Fitting NVZ boundaries to physical blocks COST Action 869 Mitigation options for nutrient reduction in surface water and groundwater
Mapping nitrate vulnerability Recompilation of the N-leaching hazard map Simple inference model withfew but really dominant environmental factors increasing the number of environmental factors COST Action 869 Mitigation options for nutrient reduction in surface water and groundwater improving the applicability of the environmental factors sophisticated estimation quantifying expert knowledge* standardization wi weights in the general linear model *KI-PA method zonalization/regionalization
Thank you for your attention! COST Action 869 Mitigation options for nutrient reduction in surface water and groundwater