Download

1 / 87
890 likes | 1.32k Views
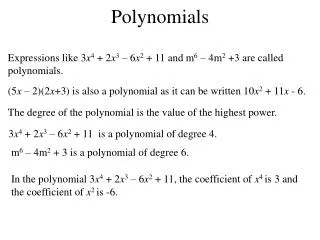
Polynomials. Chapter 6. 6.1 - Polynomial Functions. Objectives. By the end of today, you will be able to… Classify polynomials Model data using polynomial functions. http:// www.youtube.com/watch?v = udS-OcNtSWo. Vocabulary. A polynomial is a monomial or the sum of monomials.

E N D
Polynomials Chapter 6
Objectives By the end of today, you will be able to… • Classify polynomials • Model data using polynomial functions
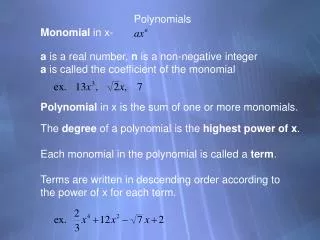
Vocabulary • A polynomial is a monomial or the sum of monomials. • The exponent of the variable in a term determines the degree of that polynomial. • Ordering the terms by descending order by degree. This order demonstrates the standard form of a polynomial. P(x) = 2x³- 5x² - 2x + 5 Constant Term Leading Coefficient Cubic Term Quadratic Term Linear Term
Standard Form of a Polynomial • For example: P(x) = 2x3 – 5x2 – 2x + 5
Parts of a Polynomial P(x) = 2x3 – 5x2 – 2x + 5 • Leading Coefficient: • Cubic Term: • Quadratic Term: • Linear Term: • Constant Term:
Parts of a Polynomial P(x) = 4x2 + 9x3 + 5 – 3x • Leading Coefficient: • Cubic Term: • Quadratic Term: • Linear Term: • Constant Tem:
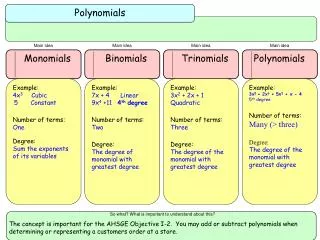
Classifying Polynomials We can classify polynomials in two ways: • By the number of terms
Classifying Polynomials 2) By the degree of the polynomial (or the largest degree of any term of the polynomial.
Classifying Polynomials Write each polynomial in standard form. Then classify it by degree AND number of terms. • -7x2 + 8x5 2. x2 + 4x + 4x3 + 4 3. 4x + 3x + x2 + 5 4. 5 – 3x
Cubic Regression We have already discussed regression for linear functions, and quadratic functions. We can also determine the Cubic model for a given set of points using Cubic Regression. • STAT Edit • x-values in L1, y-values in L2 • STAT CALC • 6:CubicReg
Cubic Regression Find the cubic model for each function: • (-1,3), (0,0), (1,-1), (2,0) • (10, 0), (11,121), (12, 288), (13,507)
Picking a Model Given Data, we need to decide which type of model is the best fit.
xy 0 2.8 2 5 4 6 6 5.5 8 4 Linear model Quadratic model Cubic model Comparing Models Using a graphing calculator, determine whether a linear, quadratic, or cubic model best fits the values in the table. Enter the data. Use the LinReg, QuadReg, and CubicReg options of a graphing calculator to find the best-fitting model for each polynomial classification. Graph each model and compare. The quadratic model appears to best fit the given values.
You have already used lines and parabolas to model data. Sometimes you can fit data more closely by using a polynomial model of degree three or greater. • Using a graphing calculator, determine whether a linear model, a quadratic model, or a cubic model best fits the values in the table.
Factored Form • The Factored form of a polynomial is a polynomial broken down into all linear factors. • We can use the distributive property to go from factor form to standard form.
Factored to Standard Write the following polynomial in standard form: (x+1)(x+2)(x+3)
Factored to Standard Write the following polynomial in standard form: (x+1)(x+1)(x+2)
Factored to Standard Write the following polynomial in standard form: x(x+5)2
Standard to Factored form To Factor: • Factor out the GCF of all the terms • Factor the Quadratic Example: 2x3 + 10x2 + 12x
Standard to Factored form Write the following in Factored Form 3x3 – 3x2 – 36x
Standard to Factored form Write the following in Factored Form x3 – 36x
Relative Maximum: The greatest Y-value of the points in a region. • Relative Minimum: The least Y-value of the points in a region. • Zeros: Place where the graph crosses x-axis • y-intercept: Place where the graph crosses y-axis Vocabulary
Relative Max and Min Find the relative max and min of the following polynomials: • f(x) = x3 +4x2 – 5x • Relative min: • Relative max: • f(x) = -x3 – 7x2 – 18x • Relative min: • Relative max: Calculator: 2nd CALC Min or Max Use a left bound and a right bound for each min or max.
Finding Zeros When a Polynomial is in factored form, it is easy to find the zeros, or where the graph crosses the x-axis. EX: Find the Zeros of y = (x+4)(x – 3)
Factor Theorem The Expression x – a is a linear factor of a polynomial if and only if the value a is a zero of the related polynomial function.
Find the Zeros Find the Zeros of the Polynomial Function. • y = (x – 2)(x + 1)(x + 3) • y = (x – 7)(x – 5)(x – 3)
Writing a Polynomial Function Give the zeros -2, 3, and -1, write a polynomial function. Then classify it by degree and number of terms. Give the zeros 5, -1, and -2, write a polynomial function. Then classify it by degree and number of terms.
Repeated Zeros A repeated zero is called a MULITIPLE ZERO. A multiple zero has a MULTIPLICITY equal to the number of times the zero repeats.
Find the Multiplicity of a Zero Find any multiple zeros and their multiplicity y = x4 + 6x3 + 8x2
Find the Multiplicity of a Zero Find any multiple zeros and their multiplicity • y = (x – 2)(x + 1)(x + 1)2 • y = x3 – 4x2 + 4x
Vocabulary • Dividend: number being divided • Divisor: number you are dividing by • Quotient: number you get when you divide • Remainder: the number left over if it does not divide evenly • Factors: the DIVISOR and QUOTIENT are FACTORS if there is no remainder
Long Division Divide WITHOUT a calculator!! 1. 2.
Using Long Division on Polynomials Using the same steps, divide.
Using Long Division on Polynomials Using the same steps, divide.
Using Long Division on Polynomials Using the same steps, divide.
Synthetic Division Step 1: Switch the sign of the constant term in the divisor. Write the coefficients of the polynomial in standard form. Step 2: Bring down the first coefficient. Step 3: Multiply the first coefficient by the new divisor. Step 4: Repeat step 3 until remainder is found.
Example Use Synthetic division to divide 3x3 – 4x2 + 2x – 1 by x + 1
Example Use Synthetic division to divide X3 + 4x2 + x – 6 by x + 1
Example Use Synthetic division to divide X3 + 3x2 – x – 3 by x – 1
Remainder Theorem Remainder Theorem: If a polynomial P(x) is divided by (x – a), where a is a constant, then the remainder is P(a).
Using the Remainder Theorem Find P(-4) for P(x) = x4 – 5x2 + 4x + 12.
Solving by Graphing: 1st Way Solutions are zeros on a graph • Step 1: Solve for zero on one side of the equation. • Step 2: Graph the equation • Step 3: Find the Zeros using 2nd CALC (Find each zero individually)