Download
1 / 13
140 likes | 388 Views
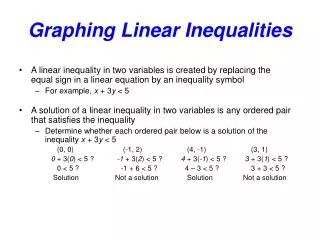
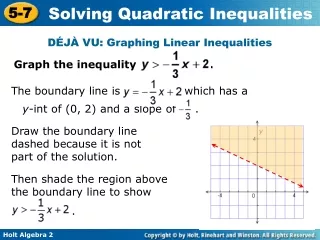
Graphing Linear Inequalities. Steps to Graphing A two-variable linear inequality. When you graph an inequality, start as you would with any equation. Steps to Graphing A two-variable linear inequality. Determine the region for the solution. (“ means y is going to be below or on the line,

E N D
Steps to GraphingA two-variable linear inequality When you graph an inequality, start as you would with any equation.
Steps to GraphingA two-variable linear inequality Determine the region for the solution. (“ means y is going to be below or on the line, so the boundary line is solid and the region below is shaded.)
Steps to GraphingA two-variable linear inequality Shade the solution area. (“ means y is going to be below or on the line, so the boundary line is solid and the region below is shaded.)
Steps to GraphingA two-variable linear inequality When “y” is isolated: • “<” dotted line, shade below • “>” dotted line, shade above • “≤” solid line, shade below • “≥” solid line, shade above ** This only works when the y-variable is isolated as in slope-intercept form. This does not work on other forms.
Why is it helpful to have the variable y alone on the left side of the inequality? You try one: It’s easy to read/graph: <, ≤ shade below; >, ≥ shade above.
Graphing inequalities in Standard form: (6,0) Determine the intercepts of the equation and plot them (0,4)
Pick a test point: 2(0) + 3(0) < 12? True or false? Standard form: Draw the appropriate boundary line, either solid or shaded. (0, 0) True! So shade the region containing the test point.
When is standard form convenient for graphing? Standard form: When the intercepts are integer values.
Food for thought • What happens if you test a point on the boundary? • What does the dashed boundary line on the graph of an inequality represent?