Download
1 / 34
340 likes | 435 Views
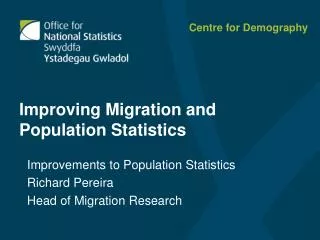
Beyond 2011 The future for population statistics? IMA Mathematics 2012 Pete Benton Beyond 2011 Programme Director Office for National Statistics. Outline. Background to the Census The Beyond 2011 Programme Statistical options for the future Key mathematical challenges Timeframes

E N D
Beyond 2011 The future for population statistics? IMA Mathematics 2012 Pete Benton Beyond 2011 Programme Director Office for National Statistics
Outline • Background to the Census • The Beyond 2011 Programme • Statistical options for the future • Key mathematical challenges • Timeframes • Next steps
The purpose of the census • The basis for national decision making: • Service planning • where to locate schools, hospitals, etc. • housing plans • transport • Resource allocation • health and local govt • £100bn each per year • Policy making and monitoring • Equality – age, sex, ethnicity, disability • Ageing population – pensions etc • Academic and social research
Key Census outputs • Benchmark statistics on: • Population units: • people and housing • with key demographics (age, sex, ethnicity) • Population structures: • households, families • Population and housing attributes • For small areas and small population groups • With multivariate analysis • Consistent and comparable
The 2011 Census • Very successful • - 94% response overall • - Over 90% across London overall • - Over 80% response in every Local Authority • Significant improvement in key Local Authorities • The result of extensive mathematical modelling • - Response targets to achieve required output quality • - Predicted initial response from key groups / areas • - Numbers of field staff required to reach final targets • - Daily live response rate modelling to support operational decisions
The Beyond 2011 Programme • Why change? – Why look beyond 2011? • Rapidly changing society • Evolving user requirements • New opportunities – data sharing • Traditional census – costly and infrequent?? • UK Statistics Authority to Minister for Cabinet Office • “As a Board we have been concerned about the increasing costs and difficulties of traditional Census-taking. We have therefore already instructed the ONS to work urgently on the alternatives, with the intention that the 2011 Census will be the last of its kind.”
Beyond 2011 : Statistical options Traditional Census (long form to everyone) • Rolling Census (over 5/10 year period) Census options • Short Form (everyone), Long form (Sample) • Short Form + Annual Survey (US model) • Aggregate analysis Administrative data options • (Intermediate) Sample linkage e.g. 1% of postcodes • 100% linkage to create ‘statistical population spine’ Survey option(s) • Address register + Survey
Beyond 2011 – statistical options FRAME SOURCES DATA OUTPUTS ESTIMATION All National to Small Area Population Data Address Admin Source CENSUS Register Population estimates Admin Source Admin Source Adjusting for missing data and error ?? Coverage Assessment Quality measurement Population distribution provides weighting for attributes incl. under & over-coverage - by survey and admin data? Comm Source increasing later? Household structure etc Commercial sources? Adjusting for non response bias in survey (or sources) Socio demographic Attribute Data Household Attribute estimates Socio demographic Survey(s) Communal Longitudinal data Maintained national address gazetteer – provides frame for population data & surveys Interactional Analysis E.g. TTWA Surveys to fill gaps
Potential data sources • Population data • NHS Patient Register • DWP/HMRC Customer Information System • Electoral roll (> 17 yrs) • School Census (5-16 yrs) • Higher Education Statistics Agency data (Students) • Birth and Death registrations • Socio-demographic sources • Surveys • DVLA? • Commercial sources? • Utilities? • TV licensing?
DWP CIS population counts compared with ONS Mid Year population estimates
Patient Register population counts compared with ONS Mid Year population estimates
Electoral Roll population counts compared with ONS Mid Year population estimates
Customer Information System UK Driving Licence School Census Coverage Of Main Administrative Sources Electoral Roll Patient Register Data Higher Education Students Missing includes: Migrants not (yet) registered Newborn babies Some private only patients Missing includes: Non higher education students Independent University students Missing includes: Non-drivers Under 17’s Some foreign-licence holders Missing includes: Some migrant worker dependants Some international students Undocumented asylum seekers Missing includes: Under 17s Ineligible voters Non responders Missing includes: Non school aged people Independent school children Home schooled children HESA DVLA DVLA ER CIS SC SC Resident Population PRD ER Extras includes: Some duplicates International students on short-term courses Students ceased studying, not formally deregistered Extras includes: Short-term migrant children Extras includes: Some duplicates Some ex-pats Some deceased Short-term migrants Extras includes: Some ex-pats Some deceased Extras includes: Multiple registrations Some ex-pats Some deceased Short-term migrants Extras includes: Some ex-pats Some deceased Short-term migrants PRD CIS
Key risks of non census alternatives • Public opinion • Technical challenge • Changes in administrative datasets • UK harmonisation • Getting a decision
Key mathematical challenges • Methods for Production of statistics • Coverage assessment and adjustment • Data matching • Correcting for missing data • Small area population attribute modelling • Methods for Protection of confidentiality • Data pre-processing and encryption • Statistical Disclosure Control • Evaluation • Quantifying financial benefits • Defining what is an ‘acceptable’ level of quality
Coverage assessment • How many fish in your pond? • Day 1, catch 100, tag them, put them back • Day 2, catch 50, find 25 already tagged • How many fish in your pond? • Answer: 200 (ish) • According to day 2, half in the pond are marked • We marked 100, so there must be about 200 altogether • “Dual System Estimation”
Application to the census • We ‘fish’ twice, in 1% of postcodes • Census • Then census coverage survey (CCS) 6 weeks later • No need for tags • They have names, addresses, dates of birth • We match the two separate lists of people (500k) to work out • What percentage of people in the CCS had first been ‘caught’ in the census • Thus, the total population in each postcode
Coverage adjustment • Apply the adjustment factor to the other 99% of postcodes where we did no CCS • With appropriate stratification • Add ‘synthetic’ records • Extra households • Extra people • With the right key characteristics • In roughly the right locations • Using ‘Donor imputation’ to complete each record • So that all the final tables add up to the right number
Dual system estimation - formulae • Counted By CCS? • Yes No TOTAL • Counted Yes n11 n10 n1+ • By Census? No n01n00n0+ • TOTAL n+1n+0n++ • Total population n++ = n1+ n+1 • n11 • We can make life very complicated for people who aren’t mathematicians!
Application to administrative data • Administrative data sources also have undercount • But the bigger problems are due to time lags • - Emigration; deaths • Results in overcount in administrative sources • - Internal migration • Results in people recorded in the wrong location • - overcount in one area, undercount in another • Just applying Dual System Estimation would result in significant over-estimation
Potential overcount estimation approaches (1) • Redesigned coverage survey asking: • who usually lives here? • when did you move in? • where are you registered to vote? • where are you registered with a GP? • who lived here before you? • where do they live now? • does John Smith still live here? • Increasing • sensitivity • Reducing • appropriateness • / legality
Potential overcount estimation approaches (2) • Match new coverage survey to admin data • Measure coverage patterns, develop models • Intermediate model • Match records only in CS postcodes • Full linkage model • Match records in all sources across all postcodes • Keep records if same location on all datasets • => more likely to be correct • Particularly if recently recorded ‘activity’ • Develop intelligent rules to resolve residual records • Reduces scale of overcount - but increases undercount
Small Area Estimation • Surveys only give sufficient precision at relatively high levels of geography • Users require information at lower levels • Census ‘output area’ ~ 125 households / 300 people • SAE - family of methods to increase precision of survey estimates at lower geographies • by “borrowing strength” from other, more detailed data sources, or neighbouring areas • Widely used by National Statistical Institutes • e.g. unemployment, income, households in poverty • - but generally univariate, estimating means
Potential components • (Very?) Large survey • Administrative sources • aggregate (area based) or unit record • available for lower geographic levels than survey outputs • Possible models • Generalised Linear Models (GLM): • multi-level models • spatial / temporal extensions can add power • Bayesian or frequentist estimation frameworks • Micro-simulation
Small area modelling - issues • Quality of ancillary data is absolutely critical • Most existing applications use census covariates • More powerful models incorporate time and space effects, but are more complex • Every variable is different, and requires different models • There’s often no substitute for geography as a predictor • ‘similar people gather in similar areas’ • BUT clear academic view – the methods exist, it just depends on data
TRADITIONAL CENSUS SOLUTION 2015 2016 2017 2018 2019 2020 2021 2022 2023 procure / develop detailed develop /test rehearse run outputs design 2011 2012 2013 2014 research / definition initiation BEYOND 2011 ‘Phase 1’ population population detailed procure / develop / characteristics estimates design develop test outputs 2015 2016 2017 2018 2019 2020 2021 2022 2023 ADMIN DATA SOLUTION Beyond 2011 - Timeline - the key decision Sept 2014 recommendation & decision point
Beyond 2011 - Timeline (non census solution) 2011 2012 2013 2014 2015 2016 2017 2018 2019 2020 2021 2022 2023 2024 population population detailed procure / develop / research / definition initiation characteristics estimates design develop test outputs coverage surveys continuous assessment testing attribute surveys info from existing surveys – e.g. labour force survey, integrated household survey etc linkage increasing linkage over time modelling increasing modelling over time address register required on an ongoing basis – ideally the National Address Gazetteer – subject to confirmation of quality public sector & commercial ? admin sources developing over time supplemented by new targeted surveys as required test
Beyond 2011 - and into the future 2023 2024 2025 2026 2027 2028 2029 2030 2031 2032 2033 2034 2035 2036 2037 2038 regular production of population and attribute estimates ongoing methodology refinement address register required on an ongoing basis and be added & develop over time administrative sources will change and disappear continuous coveragesurvey need for attributesurveys declines over time ? existing surveys increasing linkage over time increasing modelling over time
2013 2021 2031 accuracy of population estimates accuracy of characteristics estimates range of topics small area detail multivariate small area detail Improving quality & quantity experimental statistics develop to become national statistics
Census Alternativemethod Benefit 2011 2021 2031 2041 Statistical benefit profile loss loss gain gain
Census Cost ???Alternative method 2011 2021 2031 2041 Cost profile (real terms)
Next steps • Research potential methods and models • Using census data • To understand coverage patterns in admin data • To simulate new survey designs • As a gold standard – how well can we replicate census results? • Assess quality, costs, benefits, risks • Discuss with stakeholders (!) • Public acceptability research • Report progress every six months • Make recommendations in 2014