Download
1 / 16
160 likes | 351 Views
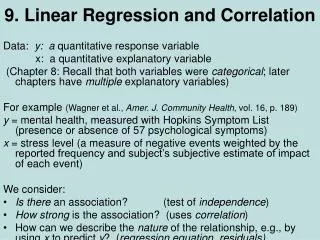
Correlation and Linear Regression. Tools : S catterplot, correlation coefficient , linear regression. If two variables are somehow related, there would be some trend in the scatter plot. 1. Scatterplot. Scatterplot Q2. Scatterplot. Linearity; Direction ; Outlier.

E N D
Correlation and Linear Regression
Tools: Scatterplot, correlation coefficient, linear regression
If two variables are somehow related, there would be some trend in the scatter plot. 1. Scatterplot
Scatterplot Linearity; Direction; Outlier
2. Correlation Coefficient Measure the strenght of the linear relationship of two variables. Sign: + , - Magnitude: [-1,1] Partial correlation
Correlation Coefficient Q3 • Pearson correlation
Regression Model Assumptions: Error follows a normal distribution with mean0 andconstant standard deviation σ.
Q1 e) iii. Independent two-sample t test vs. t-test about the slope in regression model
Check normality? same constant standard deviation?
Data Transform data Recode into different variables • Data Select cases • Analyze Descriptive Explore (QQ Plot) • Analyze Compare Means Independent samples t-test (One sided!)