Download
1 / 16
160 likes | 592 Views
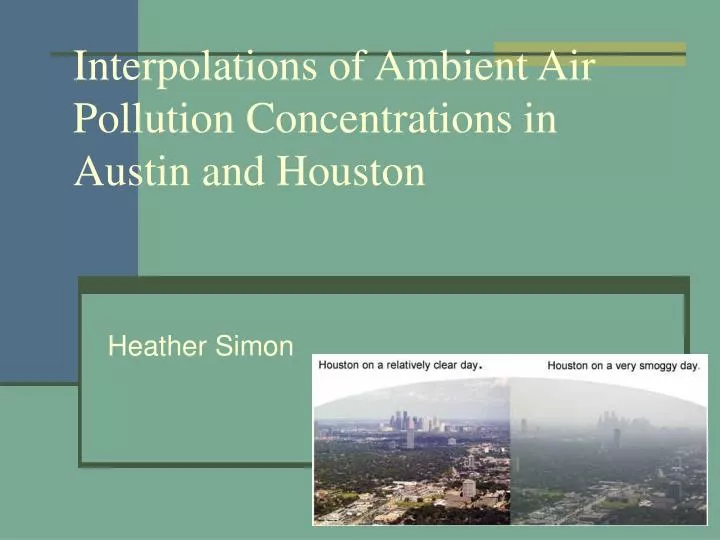
Interpolations of Ambient Air Pollution Concentrations in Austin and Houston. Heather Simon. Importance of Air Pollution Monitors. Show compliance with EPA standards Alert communities if pollutant concentrations reach a level that poses an immediate risk

E N D
Interpolations of Ambient Air Pollution Concentrations in Austin and Houston Heather Simon
Importance of Air Pollution Monitors • Show compliance with EPA standards • Alert communities if pollutant concentrations reach a level that poses an immediate risk • Provide valuable data to scientists studying air pollution chemistry
TCEQ Monitoring System • 212 monitors in Texas • 63 monitors in Houston/Galveston region • Measure meteorological conditions • Wind speed • Wind direction • Solar flux • Temperature • Measure pollutant concentrations • NOx • ozone • PM2.5 • CO • SO2
Objectives • Map pollutant concentrations for a specific air pollution episode (June 2, 2005) • Show where pollution concentrations are good/moderate/dangerous • Compare Houston to Austin • Discuss sources of pollution • Interpolate pollution data to visualize concentrations in areas other than at monitoring locations • Determine where more monitors are most needed • Locations of highest uncertainty • Locations where high uncertainties overlap for multiple pollutants • Locations where air quality is bad
images of all the layers that were imported. Imported Data Layers
Wind Data TCEQ emissions plume animation
Conclusions • Ozone did reach levels of concern in Houston • Mapping and interpolation allowed us to see a clear spatial trend in ozone concentrations • Wind data showed that most ozone in Houston originated from the industrial areas, not the urban core • Based on uncertainty in ozone interpolations, monitors should be placed to the north and southwest of the city • Since ozone concentrations are low to the southwest, first priority should be put on the northern monitors • Note of caution: conclusions drawn from a single day of data may not be universally applicable
Data Sources • County, city, urban area, highway, and monitoring point layers were obtained from the Texas Natural Resource Information System. http://www.tnris.state.tx.us/DigitalData/data_cat.htm • Pollutant concentrations and meteorological data were obtained from the Texas Commission on Environmental Quality. http://www.tceq.state.tx.us/cgi-bin/compliance/monops/daily_summary • Air Trajectories were obtained from the National Oceanographic and Atmospheric Administration. http://www.arl.noaa.gov/ready/open/hysplit4.html • Air Quality Index information was obtained from the United States Environmental Protection Agency. http://airnow.gov/index.cfm?action=static.publications
Acknowledgements • Dr. Maidment • GIS classmates