Download
1 / 29
290 likes | 403 Views
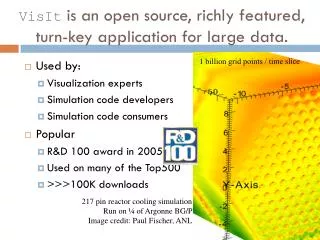
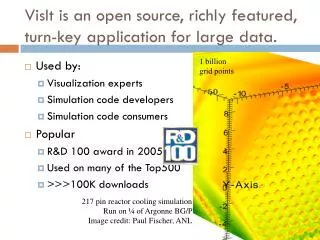
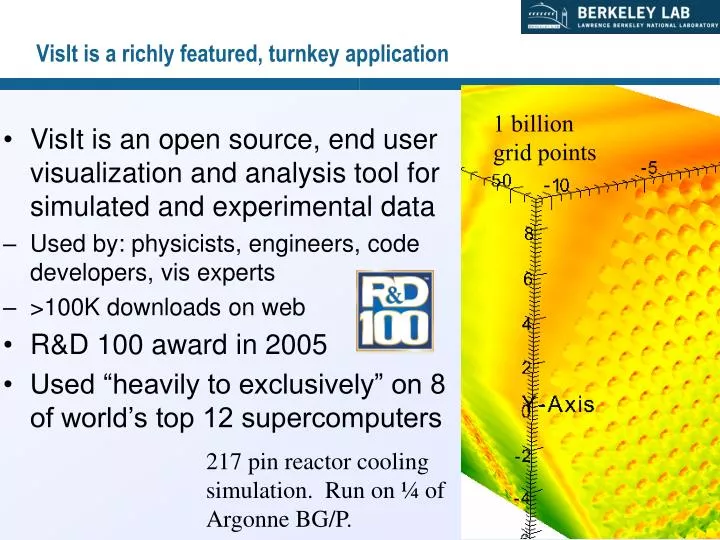
VisIt is a richly featured, turnkey application. 1 billion grid points. VisIt is an open source, end user visualization and analysis tool for simulated and experimental data Used by: physicists, engineers, code developers, vis experts >100K downloads on web R&D 100 award in 2005

E N D
VisIt is a richly featured, turnkey application 1 billion grid points • VisIt is an open source, end user visualization and analysis tool for simulated and experimental data • Used by: physicists, engineers, code developers, vis experts • >100K downloads on web • R&D 100 award in 2005 • Used “heavily to exclusively” on 8 of world’s top 12 supercomputers 217 pin reactor cooling simulation. Run on ¼ of Argonne BG/P. 4 1
Terribly Named!! Intended for more than just visualization! Visual Debugging ? = Quantitative Analysis Data Exploration Comparative Analysis Presentations 2
VisIt has a rich feature set that can impact many science areas. • Meshes: rectilinear, curvilinear, unstructured, point, AMR • Data: scalar, vector, tensor, material, species • Dimension: 1D, 2D, 3D, time varying • Rendering (~15): pseudocolor, volume rendering, hedgehogs, glyphs, mesh lines, etc… • Data manipulation (~40): slicing, contouring, clipping, thresholding, restrict to box, reflect, project, revolve, … • File formats (~85) • Derived quantities: >100 interoperable building blocks +,-,*,/, gradient, mesh quality, if-then-else, and, or, not • Many general features: position lights, make movie, etc • Queries (~50): ways to pull out quantitative information, debugging, comparative analysis 3
localhost – Linux, Windows, Mac VisIt employs a parallelized client-server architecture. Graphics Hardware remote machine • Client-server observations: • Good for remote visualization • Leverages available resources • Scales well • No need to move data User data Parallel vis resources • Additional design considerations: • Plugins • Multiple UIs: GUI (Qt), CLI (Python), more… 4
The VisIt team focuses on making a robust, usable product for end users. • Manuals • 300 page user manual • 200 page command line interface manual • “Getting your data into VisIt” manual • Wiki for users (and developers) • Revision control, nightly regression testing, etc • Executables for all major platforms • Day long class, complete with exercises Slides from the VisIt class 5
More developers Entering repo all the time SciDAC Outreach Center enables Public SW repo 2005 R&D100 Developers from LLNL, LBL, & ORNL Start dev in repo LLNL user community transitioned to VisIt GNEP funds LLNL to support GNEP codes at Argonne UC Davis & UUtah research done in VisIt repo AWE enters repo Project started Partnership with CEA is developed Institutional support leverages effort from many labs VACET is funded Saudi Aramco funds LLNL to support VisIt VisIt is a vibrant project with many participants. User community grows, including AWE & ASC Alliance schools 2003 2007 2007 2004-6 ‘07-’08 ‘07-’08 2000 2005 Summer‘07 Spring ‘08 Spring ‘07 • Over 50 person-years of effort • Over one million lines of code • Partnership between: Department of Energy’s Office of Nuclear Energy, Office of Science, and National Nuclear Security Agency, and among others Fall ‘06 2008 Spring ‘09 6
VisIt: What’s the Big Deal? • Everything works at scale • Robust, usable tool • Vis to code development to scientific insight 7
VisIt was recently demonstrated to show good performance at unprecedented scales. 16K #cores Problem Size Model Machine 8K 0.5T IBM P5 Purple 16K 1T Sun Ranger 1T X86_64 Juno 32K 2T Cray XT5 JaguarPF 64K 4T BG/P Dawn 16K, 32K 1T, 2T Cray XT4 Franklin • Weak scaling study: ~62.5M cells/core 8
Three Ways To Get Data Into VisIt • (1) Write to a known output format • (2) Write a plugin file format reader • (3) Integrate VisIt “in situ” • “lib-VisIt” is linked into simulation code • (Note: Memory footprint issues with implementation!) • Use model: • simulation code advances • at some time interval (e.g. end of cycle), hands control to lib-VisIt. • lib-VisIt performs vis & analysis tasks, then hands control back to simulation code • repeat 9
Tutorial schedule • 10 minute overview (done) • 6 part tutorial on using VisIt • Introduction • Data analysis / expressions • Scripting • Moviemaking • Comparisons • Alternate data representations • Data model overview • Database plugin development example • Operator plugin development example • Presentation on VisIt architecture / parallel algorithms 10
Before we begin… • Tutorial: • Hank Childs (hchilds@lbl.gov), Sean Ahern (ahern@ornl.gov) • Script: http://www.visitusers.org/index.php?Title=Short_Tutorial • Another tutorial upcoming SC09 • User resources: • Main website: http://www.llnl.gov/visit • Wiki: http://www.visitusers.org • Email: visitusers@ornl.gov • Development resources: • Email: visit-developers@ornl.gov • SVN: http://portal.nersc.gov/svn/visit 11
Outline • Parallelism • Contracts • Volume rendering • Streamlines • Data model • AMR • Subset Inclusion Lattices • CSG • Miscellaneous • More on steering • Synthetic Diagnostics
Contracts are an extension to the standard data flow network design. File Reader (Source) Exec V2 Slice Filter Contour Filter V0 V1 Renderer (Sink) Data Flow Networks “101”: • Work is performed by a pipeline • A pipeline consists of data objects and components (sources, filters, and sinks) • Pipeline execution begins with a “pull”, which starts Update phase Update Execute • Data flows from component to component during the Execute phase Extension: • Contracts are coupled with the Update phase
Operating on Optimal Subset of Data … V(I+1) Slice Filter V(I) … Contract * SliceFilter::ModifyContract (Contract *V(I)) { ... return V(I+1); } Filter (base class) (inheritance) Slice Filter Hundreds of others • Get meta-data • Determine domains that intersect slice • Restrict list of domains to process in V(I+1)
Operating on Optimal Subset of Data D0 D1 D2 D3 … V(I+1) Slice Filter V(I) … D0 D1 D2 D3 • Get meta-data • Determine domains that intersect slice • Restrict list of domains to process in V(I+1)
The contract-based system provides high flexibility for this optimization. … … V(I+1) V(J+1) Spherical Slice Filter Slice Filter V(I) V(J) … … … … A new, plugin filter can use this optimization without any modification to base data flow network architecture V(I+1) Contour Filter V(I) Multiple filters can use the same optimizations …
Visualization of massive data requires sophisticated algorithms. • “Image Space” Partition • Redundant I/O • Each frame requires new partition A hybrid approach that acts as a world space partition, but identifies regions of imbalanceand handles those regions using an image space partition. • “World Space” Partition • Camera inside data set causes huge imbalance.
This analysis depended on improvements in parallel particle advection P2 P4 P1 P0 P3 P2 P1 P3 P4 P0 P0 P4 P1 P3 P2 P0 P1 P3 P4 P2 P1 P3 P0 P4 P2 • Two extremes: • Partition data over processors and pass particles amongst processors • Parallel inefficiency! • Partition seed points over processors and process necessary data for advection • Redundant I/O! P0 P1 P3 P2 P4 Notional streamline example
This analysis depended on improvements in parallel particle advection • Hybrid solution: • Master-slave approach that adapts between parallel inefficiencies and redundant I/O P0 P0 0: Read • Decision of when to pass or read is simplified here and based on load of processors owning data. • Heuristic weights against I/O, but allows for redundant I/O • - All coordination done by slave masters. P1 1: Pass 0: Read P2 P1 P3 P2 1: Read P4 1: Pass Notional streamline example
AMR is handled natively in VisIt • VisIt understands: • Nesting of patches / Boundaries between patches • Strategy: • Each patch is processed separately • After reading data, subsequent passes to: • Identify coarse elements that are refined and mark them as “ghost” • Create ghost layers around outer boundaries (needs work) • UI: • Color by patch, color by level • Remove / show patches, levels • Have appropriate info returned for picks
CSG Visualization • Adaptively creates a volumetric representation • Supported shapes • Sphere • Cone • Cylinder • Plane • Quadric • Tetrahedron • Pyramid • Prism • Hexahedron
Users need to reference their data “as they know it”. • Many different decompositions of data: • By simulation processor ID • By material • By part in an assembly • By level/patch for AMR • Plus key subsets, nodes/elements representing: • Boundary conditions • Slide surfaces • Probes We need to allow users to cull away unneeded subsets of the data.
Representing data relationships • Relationships between many decompositions are complicated. • Need sophisticated machinery to store this knowledge. • Machinery must be customizable to give right “look and feel”. • Idea: incorporate Subset Inclusion Lattices (SIL)
Subset Inclusion Lattices (SILs) • SIL: directed, acyclic graph • Bipartite: one set of nodes for subsets, the other for categories • Encodes relationships between sets (i.e. subset relations) • Also encodes “category” of that relation (i.e. material, processor ID, etc)
VisIt has full built-in support for SILs • VisIt supports over fifty file formats. • Now each can present data subsets to users in an appropriate way. • VisIt can build GUI windows, etc, based on a SIL construction. • VisIt creates SILs based on basic information (material names, # of processors, etc) • Only have to modify a SIL for advanced cases.
Simulation steering • Simple steering • Scalar inputs to the simulation • Specified through a GUI • Dashboard of status • Built by extending our simulation monitoring • Simulation code can specify a custom GUI window • Loaded through a Qt UI file built with Qt Designer • State is synchronized between VisIt and simulation Simulation name Simulation value pairs Simulation status Engine controls Commands control Component name Text value 27
Quantitative analysis means different things to different people. Detector provided by VisIt (synthetic diagnostic) Detector at AGEX • Techniques that span scientific domains (e.g. integration, volumes, surface areas, fluxes, etc.) • Techniques specific to scientific domains (e.g. hohlraum flux at AGEX)
… and we’re done. • Tutorial: • Hank Childs (hchilds@lbl.gov), Sean Ahern (ahern@ornl.gov) • Script: http://www.visitusers.org/index.php?Title=Short_Tutorial • Another tutorial upcoming SC09 • User resources: • Main website: http://www.llnl.gov/visit • Wiki: http://www.visitusers.org • Email: visitusers@ornl.gov • Development resources: • Email: visit-developers@ornl.gov • SVN: http://portal.nersc.gov/svn/visit 29