Download
1 / 67
670 likes | 798 Views
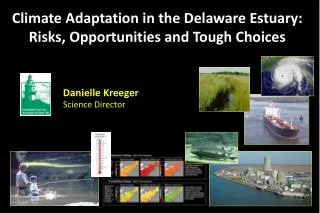
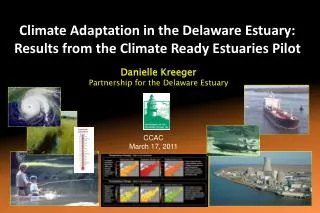
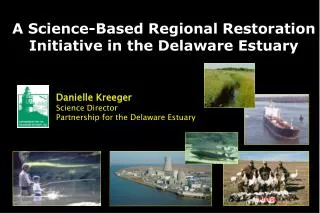
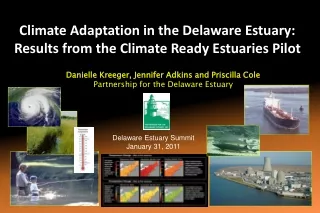
The Delaware Estuary Climate Ready Pilot. Danielle Kreeger Science Director Priscilla Cole Science & Policy Fellow. Climate Change in a Complex Landscape.

E N D
The Delaware Estuary Climate Ready Pilot Danielle KreegerScience DirectorPriscilla ColeScience & Policy Fellow
Climate Change in a Complex Landscape Upper Watershed: “pristine” recreational area water supply for NYCTidal River: 4th largest USurban center world’s largest freshwater port 70% of east coast oil Major industry buildupLower Estuary: Water fowl, finfish, shellfish Horseshoe crab population 13,611 square miles DK 2
Climate Change in the Delaware Estuary Temp Salinity Sea Level Rise Storms Drinking Water Marshes Bivalves • Likely Physical Changes 2. Example Effects on Resources DK 3
Natural Resource Patterns • Disruption – species or community effects Climate Change in the Delaware Estuary • Disconnects– de-coupled ecological interactions • Thresholds – non-linear responses • Synergisms – climate effects + other changes DK 4
Disruptions Example: Species Range Shifts DK 5
Disconnects (Hypothetical Example) Decoupling of Horseshoe Crab Spawning and Shorebird Migration Website slides are from the Delaware Shorebird Project and the Horseshoe Crab Conservation Network
Smooth Response Tolerance Limits Breached Likely Abrupt Response Ecosystem Response Ecosystem Response Threshold Extent of Climate Change Extent of Climate Change Thresholds (Non-linear Responses) Unlikely Slide adapted from Carlos Duarte DK 8
Non-linear tipping points in ecosystem status Once breached, ”recovery” may be slow or unlikely Ecological Thresholds Slide from Carlos Duarte DK 9 Pressure (Climate change) Knowing where these tipping points are will be extremely valuable to set policy targets (Climate-driven Thresholds)
Synergisms – Climate & Other Changes Together “… The interaction between climate change and habitat loss might be disastrous. During climate change, the habitat threshold occurs sooner. Similarly, species suffer more from climate change in a fragmented habitat.” DK 10
Hot Topics DK 11 • Ecological Flows • Land Use Change • LNG Terminal • Spills, NRDA • Dredging • Withdrawals • Inundation, SLR • Horseshoe Crabs, Red Knots • Emerging Pollutants
Complexity = Challenges DK 12
Lesson: “Restore” for the Future • Forecast future sustainable states • Smart “restoration” = climate adaptation DK 13 • Shifts in policy and management paradigms likely to be needed
PDE Climate Ready Pilot • Goal– perform a vulnerability assessment and draft adaptation plan for one or more case studies • Tasks • Vulnerability Assessment - Inventory threats to natural resources • Valuation - Assess natural goods and services that are at risk • Identify Options – List response scenarios, early warning monitoring needs • Prioritize – Rank options to safeguard or enhance resources at risk • Recommendations - Provide managers and policy-makers guidance on how to achieve greatest natural resource outcomes • Next Steps – Identify future needs such as high priority data gaps, strategies for other resources, cross-linking via ecosystem models Ambitious DK 14
ID Vulnerabilities Ecological Valuation Tidal Marshes Bivalve Shellfish Adaptation Options Recommendations and Reporting Drinking Water Climate Adaptation Planning Case Studies DK 15
Adaptive Adaptation Case Study Subgroups Prioritization Outreach, Education, Messaging Management and Policy PDE Climate Ready Approach DK 16 Climate Workgroup Adaptation Plan DK 16
Climate Adaptation Work Group (CAWG) STAC-affiliated; Co-Chairs: Najjar & Kreeger ID Vulnerabilities Tidal Wetland Sub-group Velinsky & Kreeger Ecological Valuation Shellfish Sub-group Kraeuter & Kreeger Drinking Water Sub-group Connolly Adaptation Options Predications & Modeling Team Najjar Recommendations and Reporting $ Natural Capital Team Cole Climate Adaptation Planning Work Groups DK 17
Climate Adaptation Work Group (CAWG) STAC-affiliated; Co-Chairs: Najjar & Kreeger ID Vulnerabilities Tidal Wetland Sub-group Velinsky & Kreeger Ecological Valuation Shellfish Sub-group Kraeuter & Kreeger Drinking Water Sub-group Connolly Adaptation Options Predications & Modeling Team Najjar Recommendations and Reporting $ Natural Capital Team Cole Climate Adaptation Planning Work Groups DK 18
Climate model results for the watershed of the Delaware Estuary Raymond Najjar Department of Meteorology The Pennsylvania State University May 2009 DK 19
21st Century Climate Projections • Projections shown as changes with respect to 1980-1999 for three future time periods: • 2011-2030 (early century) • 2046-2065 (mid century) • 2080-2099 (late century) • B1 (lower emissions) and A2 (higher emissions) scenarios are shown. • Changes shown using box-and-whisker plots, which present 14-model maximum, minimum, median, 25th percentile, and 75th percentile. R. Najjar, PSU – Draft not for distribution DK 20
Temperature Annual • More warming in summer than winter • Scenario differences minor until late century Winter Summer R. Najjar, PSU – Draft not for distribution DK 21
Annual Precipitation • Annual precipitation increase • Greater increase and agreement among models in winter than summer • Less agreement among models for precipitation than temperature Winter Summer R. Najjar, PSU – Draft not for distribution DK 22
Frost Days Annual frost days and growing season length changes • Warmer spring and fall means fewer frost days and longer growing seasons GrowingSeason R. Najjar, PSU – Draft not for distribution DK 23
Heat Waves Consec. Days >100oF • All models project increases in heat waves • Large spread among models Days >90oF Days >80oF R. Najjar, PSU – Draft not for distribution DK 24
Summary of climate projections (Najjar) • Early-century results independent of emissions scenario - climate change is unavoidable • All models warm • Precipitation projected to increase, particularly in winter and spring • Extreme precipitation and extreme heat are projected to increase R. Najjar, PSU – Draft not for distribution DK 25
ID Vulnerabilities Ecological Valuation Tidal Marshes Bivalve Shellfish Adaptation Options Recommendations and Reporting Drinking Water Climate Adaptation Planning Case Studies DK 26
Tidal Wetlands DK 27
Rutgers University Tidal Wetlands • A Signature Trait of System • Near Contiguous Band • Diverse: Freshwater Tidal Marshes • Brackish Marshes • Salt Marshes • Ecological Values: • Structural • biodiversity • habitat for fish and wildlife • nurseries for imperiled taxa • Functional • food web • water quality • flood protection DK 28
Estuarine / Marsh Coastal Ecosystem Tidal Freshwater Marsh Salt Marsh River Estuary Ocean Slide from Nat Weston, Villanova
DK Degradation
Angola Neck – Rehoboth Bay, DE Summer, 2006 Sudden Wetland Dieback – Marsh Browning Slide from Chris Bason (Center for Inland Bays, DE)
Freshwater Tidal Wetland Acreage Estimated < 5% remains DK 32
Tidal Wetlands 1992 Concerns: Degradation Conversion & Loss Sea level rise 2006 Canary Creek Marsh, DE DK 33
ShorelineErosion Courtesy D. Bushek, Rutgers Courtesy J. Gebert, ACOE DK 34
Satellite Data – Kearney and Riter 1993 Percent vegetation 2006 DK 36
Satellite Data – Kearney and Riter 1993 Percent vegetation near Philadelphia airport 2006 DK 37
Tidal Wetlands Ecological Values: Structural habitat Functional food web water quality flood protection Concerns: Degradation Conversion & Loss Sea Level Rise Storms DK 38
Living Shorelines 2008 Tidal Wetlands Concerns: Degradation Conversion and Loss Sea Level Rise Storms Sediment budget DK 39
Tidal Wetlands Adaptation PlanningGoal: Maximize long-term ecosystem health and resiliency • Tough Choices • Where will wetlands will be • converted to open water? • Where can we save them ? • Where is strategic retreat • the best option? DK 40
Tidal marshes need to move: 1) horizontally (landward) and/or 2) vertically (to keep pace) Can they do it? Where? Slide adapted from Michael Craghan, Rutgers DK 41
Projecting the Fate of Tidal Wetlands and Their Ecosystem Services Using SLAMM Modeling - Industrial Economics 2000 2100 • Areas for Model Improvement • Erosion/Accretion Rates • Better Vegetation Classifications • Marsh Drowning Mechanisms
ID Vulnerabilities • Subgroup Formed • Initiating Vulnerability Assessment • Draft by September Tidal Wetland Sub-group Ecological Valuation Adaptation Options Late Fall Recommendations and Reporting Winter Climate Adaptation Planning Status DK 45
ID Vulnerabilities Ecological Valuation Tidal Marshes Bivalve Shellfish Adaptation Options Recommendations and Reporting Drinking Water Climate Adaptation Planning Case Studies DK 46
11 Other Species of Freshwater Unionid Mussels Corbicula fluminea Elliptio complanata Rangia cuneata Mya arenaria Geukensia demissa Mytilus edulis Ensis directus Mercenaria mercenaria Crassostrea virginica Bivalves of the Delaware DRBC DK 47
Salt Line Location Oyster Disease, Salinity & Climate Change From Rutgers HSRL From DRBC www.livingclassrooms.org/lbo/dermo/oyster2.jpg Rutgers: “A small increase in salinity over the seed beds may push the oysters past a point of no return” DK 48
No Help With Help Oyster ManagementCan they maintain (or be maintained) until they might see more optimal conditions? DK 49 Longer Growing Season 2 Recruitment Events Intertidal Niche Expansion? Point of No Return Today 2030 2060 Historical data from Rutgers Haskin Shellfish Laboratory