Download
1 / 11
110 likes | 217 Views
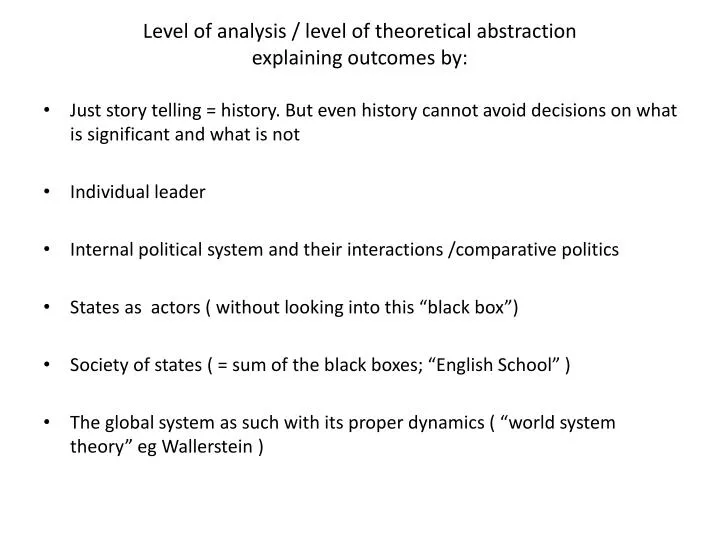
Level of analysis / level of theoretical abstraction explaining outcomes by:. Just story telling = history. But even history cannot avoid decisions on what is significant and what is not Individual leader Internal political system and their interactions /comparative politics

E N D
Level of analysis / level of theoretical abstractionexplaining outcomes by: • Just story telling = history. But even history cannot avoid decisions on what is significant and what is not • Individual leader • Internal political system and their interactions /comparative politics • States as actors ( without looking into this “black box”) • Society of states ( = sum of the black boxes; “English School” ) • The global system as such with its proper dynamics ( “world system theory” egWallerstein )
Should one use “panel studies” ( multi variant analysis) to deal with trends?? • Very common practice ( look at any of the major journals on international/global affairs ) • Drawbacks: problem of “n” • Problem of many variables including many unknown ones ( 200 reasons for the decline of Rome ) • Look at the trends as such • Only the long term counts: world wars did not make any significant changes
The linear trend • Constant ( non accelerating ) growth of the sum • Eg: growth of the global surface under agricultural production • In real world rather rare ( most trends are non linear ) • Still most frequently used in correlation – analysis ( because it is simple mathematically ) • The use of correlation = does not equal causation. Nonetheless useful for “falsification”
Non – linear; geometric • Eg: Malthus / Ehrlich (the population bomb = standing room only on earth ) • Is also rare in reality ( declining usefulness of a “genetic information” = warrior society: business model ) • At the upper end other reasons for slowdown
The “organic” S - Curve • Most common form of a trend of both biological and social phenomena • Famous metaphor: water lilies on a pond • Population affected by HIV • Yield in relation to input of fertilizer • Ownership of cell – phones • Number of wealthy states as compared to number of democracies • Growth in the wealth of a single state
S – Curves adding upeg: total “World GDP” • The inflection point and the era of slowing global economic growth is shifted into the future as the newcomers – like South Korea or now China – are growing faster than did the first “”modernizer “Great Britain 150 years ago
The bell shaped curvethe rise and fall of everything • Examples • The relative power of states ( their share of power; whatever that is ) • Kuznets curve ( income inequality and “environmental Kuznets curve” ) • Number of children per fertile mother surviving until the age of five
Ruptures; discontinuities • Examples • Population of Easter Islands • Number of towns with more than 5.000 inhabitants North of the Alps ( 10 AD– 600 AD ) • Complex systems between fragility and resilience
The global warming “hockey – stick” • What happened at this inflection point?? • A new factor was added
Two versions/ interpretations of the tool of “scenarios” • A) Projection into the future of current trends ( “surprise free scenarios”) • B) speculations on intrusion of new factors that might change the course • C) Note: social systems are self – reflective ( eg environmental “Kuznets Curve”; or disarmament )