Download
1 / 16
160 likes | 255 Views
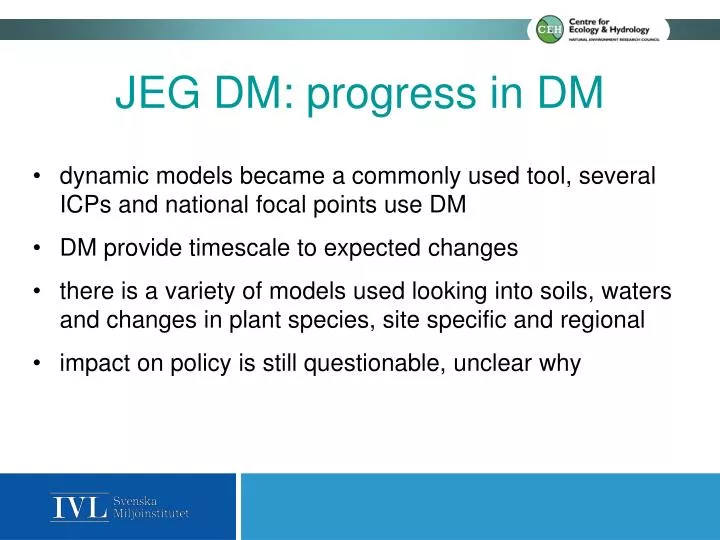
dynamic models became a commonly used tool, several ICPs and national focal points use DM DM provide timescale to expected changes there is a variety of models used looking into soils, waters and changes in plant species, site specific and regional

E N D
dynamic models became a commonly used tool, several ICPs and national focal points use DM • DM provide timescale to expected changes • there is a variety of models used looking into soils, waters and changes in plant species, site specific and regional • impact on policy is still questionable, unclear why JEG DM: progress in DM
regional studies (UK, Finland and Sweden) • MAGIC libraries (Sweden, UK) • MAGIC: C&N dynamics further developed JEG DM: modeling waters
model predictions from 2000 (RECOVER 2010) • driven by observed deposition 1995 - 2010 • comparison to observed data without re-callibrating JEG DM: older predictions revisited
Long-term record of acidification and recovery R.F. Wright2, R.C. Ferrier1, J. Aherne3, L. Camareo4, B.J. Cosby5, C.D. Evans6, M. Forsius7, J. Hruska8, A. Jenkins9, P. Kram8, J. Kopáček10, V. Majer8, F. Moldan11, M. Posch12, M. Rogora13 B.L. Skjelkvåle2 Rachel Helliwell1 and Leah Jackson-Blake1 1The James Hutton Institute, UK. 2Norwegian Institute for Water Research, Norway 3Trent University, Canada 4CEAB-CSIC, Spain 5University of Virginia, USA 6Centre for Ecology and Hydrology, UK 7Finnish Environment Institute, Finland 8Czech Geological Survey, Czech Republic 9Centre for Ecology and Hydrology, UK 10Biological Centre ASCR, Czech Republic 11IVL,Swedish Environmental Research Institute, Sweden 12Coordination Centre for Effects (CCE), The Netherlands 13Institute of Ecosystem Study, Italy
Records of surface water ANC (μeql-1) and model forecasts from 1995
Records of surface water ANC (μeql-1) and model forecasts from 1995
JEG DM: modeling vegetation • several models in use and under tests and development • observed changes are slow (decades at least), time series of observations are scarce • evaluation of models is problematic
Level 2 plots; Oak forests, woody biomas courtesy of Wieger Wamelink
Comparing the modelled and measured ground cover of plants at Gårdsjön Year 1992
Modelled ground cover of indicator plants at Gårdsjön over the period 1900 to 2100
JEG DM • dynamic models do have ability to make robust predictions of chemical status and to an extent even of impact on organisms • models have been tested and provide policy- relevant outputs (e.g. target loads) • challenge remains to make an impact on policy
JEG 12 (Oct 27 – 29 2011, Sitges) Agenda items include • outcome of call for data 2010/2011 • DM of N as a nutrient in terrestrial systems, role of DOC in acidification and recovery • DM of climate change/air pollution interactions, terrestrial carbon sequestration • DM of biological response Contact Susie Beresford (sjbe@ceh.ac.uk)