1 / 5

Understanding Coin Toss Probabilities

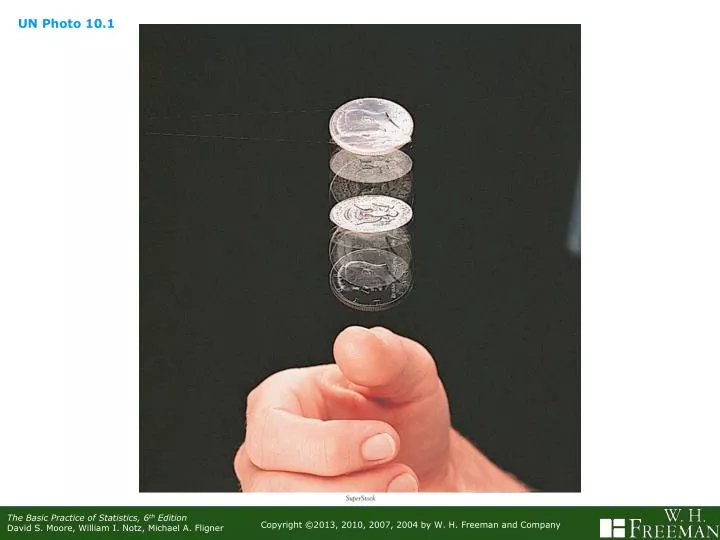
Explore how coin toss probabilities evolve over multiple trials, converging to 0.5, the probability of getting a head. This visual representation displays outcomes from 5000 tosses in two trials.

tamra
Download Presentation

Understanding Coin Toss Probabilities

An Image/Link below is provided (as is) to download presentation Download Policy: Content on the Website is provided to you AS IS for your information and personal use and may not be sold / licensed / shared on other websites without getting consent from its author. Content is provided to you AS IS for your information and personal use only. Download presentation by click this link. While downloading, if for some reason you are not able to download a presentation, the publisher may have deleted the file from their server. During download, if you can't get a presentation, the file might be deleted by the publisher.

E N D

Presentation Transcript


  1. UN Photo 10.1

  2. Figure 10.1 The proportion of tosses of a coin that give a head changes as we make more tosses. Eventually, however, the proportion approaches 0.5, the probability of a head. This figure shows the results of two trials of 5000 tosses each.

  3. Figure 10.5 Probability as area under a density curve. The uniform density curve spreads probability evenlybetween 0 and 1.

  4. Figure 10.6 The probability in Example 10.9 as an area under a Normal curve.

  5. UN Photo 10.6

More Related