Download
1 / 83
940 likes | 1.34k Views
4.1 Coordinates Objective : To plot points and name points in the coordinate plane. is formed by two real number lines that intersect at the origin. (x-axis and y-axis). A coordinate plane.

E N D
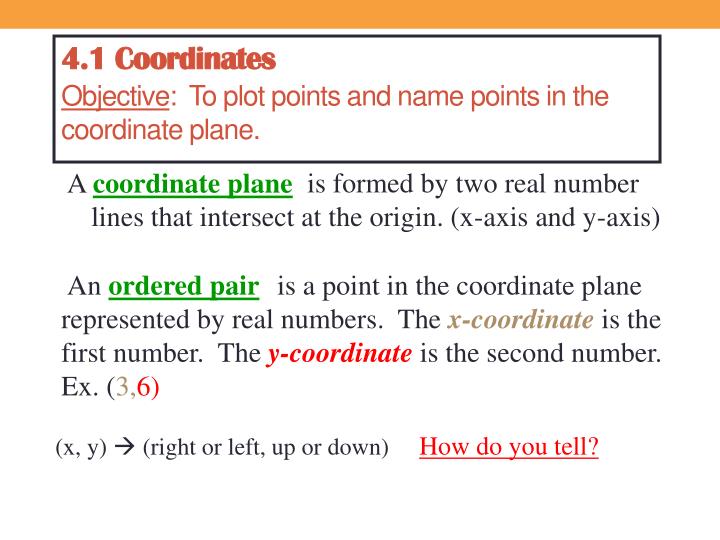
4.1 CoordinatesObjective: To plot points and name points in the coordinate plane. is formed by two real number lines that intersect at the origin. (x-axis and y-axis) A coordinate plane is a point in the coordinate plane represented by real numbers. The x-coordinate is the first number. The y-coordinate is the second number. Ex. (3,6) An ordered pair (x, y) (right or left, up or down) How do you tell?
Coordinate plane (x, y) y-axis Quadrant II (-, +) Quadrant I (+, +) Origin (0,0) x- axis Quadrant III (-, -) Quadrant IV (+, -)
Plotting points To plot a point: (3,4) Start at (0,0) Move 3 to the right (positive) Then 4 up (positive) make a point • Plot these points: • (-2, -4) • (0, 3) • (-1,0) • (6,-2) • (-4, 5)
Practice Name the following points and give the quadrant or axis where they lie. A: B: C: D: A D C B Plot the following points and label each!! E (-3, 4) F(-5, 0) G(-3, -1) H(0, 0)
The Coordinate Plane Steps to Make a Scatter Plot: • Determine what will be x and y. • x – is in charge, it changes automatically • y – depends on x, is not automatic • Determine units of each axis and label. • Find range of variable • Divide range by number of squares • Always round up to “nice” unit • Plot points.
15 14 13 12 11 10 9 8 7 6 5 4 3 2 1 0 0 1 2 3 4 5 6 7 8 9 10 11 12 13 14 15 Example Make a Scatter Plot The age (in years) of seven used cars and the price (in thousands of dollars) paid for the cars are recorded in the table. Make a scatter plot and explain what it indicates. price in $1,000 age of car How much would a 2-year old car cost?
Make a Scatter Plot Example The amount (in millions of dollars) spent in the United States on snowmobiles is shown in the table. Make a scatter plot and explain what it indicates.
Reminders • Math Lab Tomorrow - Stocks • 4.1-4.3 Quiz on Monday, Oct. 7th • Homework: • P. 206-207 #’s 10-26 EVEN, 35-37 • EXTRA CREDIT – Halloween “Goblin’ Goblin” Grid
4.2 Graphing Linear Equations Objective: To graph linear equations using a table of values. Note (1) All the Eqs. in Chap 4 refer 2 variable linear Eqs. (2) The graph of each linear eq. is a LINE The solution to a linear equation -- is an ordered pair (x, y). There are many solutions to a linear equation and all of the solutions together form a straight line,
Find out if the ordered pairs are solutions. HOW? A) -5x – 8y = 15 (-3, 0) B) -2x – 9y = 7 (-1, -1)
-1 0 1 Graph a line 5 Steps to graph a line 3 1. Pick three values for x 1 • Plug in values for x then solve for y • Solve for y, then evaluate y for all input x 3. Graph the ordered pairs 4. Connect these order pairs. This should form a straight line! y = -2x + 3
-1 0 1 Function form When an equation is solved for y = What are the advantages of putting the equation into function form? Graph the given linear equations. A) 3x – y = 2 Solve for y: We select three x values, and evaluate the corresponding y values.
Graph the given linear equations. Solve for y, B) 2x – 2y = 10 We select three x values, and evaluate the corresponding y values. What are the “good” x values we should select? The x values should make “nice” y values. (or, no fraction values for y)
Make a table of values and graph the following line: 6x – 3y = 12 2y = 4x + 1
Ex 4) y = -3 Ex 5) x = 4 Ex 6) x = -2 Ex 7) y = 0 Special Linear Equations always a vertical line x = # always a horizontal line y = # MEMORIZE THESE!!!! It’s easy! x = # , label the # on x-axis, then “cut” there y = # , label the # on y-axis, then “cut” there
Make a table of values and graph the following line: y = -3 x = 4
Summary • A two variables linear equation represents a line in x-y coordinate plan. • An ordered pair is a solution to a two variable linear equation, then the point represented by the ordered pair is on the line represented by the linear equation, and vice versa. • Remember the two types of special line by an easy way: • x = # no y cut x-axis at that # parallel to y-axis • y = # no x cut y-axis at that # parallel to x-axis
Summary • When graphing a linear equation, remember the 4 steps: • Pick a few x values • Solve for y, then evaluate y for all input x • Graph ordered pairs • Connect ordered pairs with a line
Lesson 4.2 DHQ • Decide whether the given ordered pair is a solution of 2x – 3y = 8. • (-2, -4) b. (7, -2) • Rewrite 4x – 2y = 18 in function form.
Reminders • 4.1-4.3 Quiz on Monday, Oct. 7th • Homework: • P. 214-215 #’s 15-20, 30-32, 36-37, 60
y-intercept?( , ) x-intercept? ( , ) 4.3 Quick Graphs Using Intercepts Objective: To graph lines using x and y-intercepts. Where the line or curve crosses the x-axis. This should be written as the point (x, 0) . (WHY?) What is an x-intercept? What is a y-intercept? Where the line or curve crosses the y-axis. This should be written as the point (0, y) . (WHY?) 0 3 2 0 Note x or y intercept is a point!!!
6x + 3y = 12 Remember – TWO POINTS CAN MAKE A LINE! Ex 1) Find the x and y-intercepts To find the y-intercept; let x = 0 and solve for y. To find the x-intercept; let y = 0 and solve for x. 6( 0 ) +3y = 12 6x + 3( 0 ) = 12 3y = 12 6x = 12 y = 4 x = 2 The y intercept is (0, 4) The x intercept is (2, 0)
You try these: Calculate the x and y-intercept. Then graph each line. 1. 2x – y = 4 2. 3y – 2x = -6
What happens with horizontal and vertical lines? Find the x and y-intercepts (if possible). Graph each line. Ex 2) y = 4 Ex 3) x = -1 You can set x = 0 but end with “No solution” can not find x, or no x-intercept. You can set y = 0 but end with “No solution” can not find y, or no y-intercept. y-int. (0, 4) x-int. (-1, 0) Variable x does not show up no x-intercept line is parallel to x-axis Variable y does not show up no y-intercept line is parallel to y-axis
You try these: Calculate the x and/or y-intercept. Then graph each line. 4. y = 2x + 4 5. y = -3
Graph and Write the equation of the special line 7. Vertical line passing through (-2, 3) 6. Horizontal line passing (-3, 4) and (4, 4).
Summary • x-intercept (y-intercept) is a point where the line or curve crosses the x(y)-axis. • To find x-intercept (y-intercept), just setting • y = 0 (x = 0) in an equation. • 3. When graph a line, just find x and/or y-intercept and then connect two intercepts with a line.
Find the intercepts and graph. 3) 2x – 4y = –8 4) x – 4y = 2 The point where line(curve) crosses the x-axis. Graphing with Intercepts What is an x-intercept? How do you find an x-intercept? (Why does this work?) How should you write the x-intercept? set y = 0 and then solve for x. In an order pair (x, y). The point where line(curve) crosses the y-axis. What is a y-intercept? How do you find a y-intercept? (Why does this work?) How should you write the y-intercept? set x = 0 and then solve for y. In an order pair (x, y). – 4y = –8 – 4y = 2 y = 2 y = –1/2 2x = –8 x = 2 x = –4 So – If I gave you a quiz over this material, how would you do?
Lesson 4.3 DHQ • Give the x- and y- intercepts of the graph of 2x – y = -4. • 2. Graph 2x – 3y = 6 using x and y intercepts.
Reminders • 4.1-4.3 Quiz on Monday, Oct. 7th • Homework: • P. 221-222 #’s 35-37, 44-49, 56-57
(ORDER MATTERS!) Slope: m = m = m = To read the slope from a graph, choose 2 lattice points and write a ratio of the vertical to horizontal change. Explain. 4.4 The Slope of a Line Objective: To calculate the slope of a line using 2 points, to read slope from a given line and to understand some applications of slope. 1) The measurement of the steepness and direction of a line (m) Slope is:
The slope formula – finding slopes from ordered pairs If you are given 2 points you have 2 x-values and 2 y-values. You need memorize it!!!
6) Describe how to move a slope of……. a) -2 b) c) d) 5a) Sketch a positive slope. c) Sketch a 0 slope. d) Sketch an undefined slope. b) Sketch a negative slope.
Ex 4) The store plane descends 100 feet for every 2000 feet it travels. Find the slope of decent. Ex 5) The road rises 2 feet for every 50 yards. Find the slope of the road. * REMEMBER TO CONVERT YDs to FT
(order matters!!) • Summary • There are 3 different formulas to calculate the slope:
Lesson 4.4 DHQ • Find the slope of each line. Use formula to find the slope. • (-2, 2), (0, 4) • (1, 1), (4, 2) • 2. Find the slope of the line.
Reminders • 4.4+4.6 Quiz on Wednesday, Oct. 16th • Homework: • P. 230-231 #’s 23-28, 35-36 ***38
4.6 Graph Using Slope-Intercept Form Objective: 1. To use slope intercept form to graph a line. 2. Tell the slope of two parallel lines. Slope-Intercept Form is :Memorize this form!! y = mx + b (m = slope & b = y-intercept.) • The equation must be y = to use this short-cut • m is always the coefficient of • y-intercept (b) is always x Constant – (no variable)
Solve the following equations for y = then pick out the m and b for each. -2x -2x y = –2x - 5 -2 -5
Use the slope (m) and y-intercept (b) to graph each line. 2x + y = 5 m = b = x - 2y = 4 m = b = You need to graph a) the y-intercept first and then b) use the slope to get the second (third) point (move the slope) c) connect the two (three) points by a line.
One more for you to try. 3x – 2y = –6 m = b = Can you solve for y? Can you locate the m and b? Can you put this on the graph paper? 3x – 2y = –6 -3x -3x
Summary • The slope-intercept form is the form in which y is solved. • In the slope-intercept, the number in front of x is the slope m and the number right after x is the y-intercept. • When you graph a line of slope-intercept form, you have to graph • a) the y-intercept first and then • b) use the slope to get the second (third) point • c) connect the two (three) points by a line. • 4. Parallel lines have equal slope.
Lesson 4.6 DHQ • Write x + y + 3 = 0 in slope-intercept form. Then graph the equation.
Reminders • 4.4+4.6 Quiz on Wednesday, Oct. 16th • Homework: • P. 244 #’s 13-18, 29-31
Slope-Intercept Form Organization Check: We can now graph an equation in three different ways: Using an x, y table Using x-intercepts, y-intercepts Slope-intercept form Where a line crosses the y-axis.
Write the equation in slope-intercept form, then graph. m = b =