Download
1 / 27
270 likes | 422 Views
2009-2010 POTENTIAL Budget Reductions. This list represents POTENTIAL reductions for the 2009-2010 school year. No action will be taken until May or June following the Regular Legislative Session. Criteria for Reductions. The primary objectives: to insure minimal impact on students

E N D
This list represents POTENTIAL reductions for the 2009-2010 school year. No action will be taken until May or June following the Regular Legislative Session.
Criteria for Reductions • The primary objectives: • to insure minimal impact on students • to maintain adequate staffing • Areas reviewed for reduction in the following priority order: • School Support Activities (District Level) • Non-Instructional Activities (School Level) • Instructional Activities (School Level) • If necessary to eliminate positions permanently or through attrition, areas will be reviewed for reduction in the following priority order: • Non-Instructional Personnel • Instructional Support Personnel • Administrative / Supervisory Personnel • Instructional Personnel
Assumptions • For the 2009-10 revenue availability for our schools remains questionable. • Based on State data, the projected decline for next year is an additional 9.2% or $1.6 billion. • This means an additional $633 per student cut. • For BPS, this equates to and additional cut of approximately $45 million.
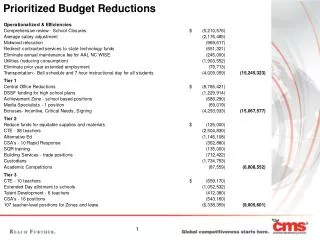
Non-Recurring Budget Cuts for Both the Operating and Capital Funds
Non-Recurring Budget Cuts for Both the Operating and Capital Funds
Non-Recurring Budget Cuts for Both the Operating and Capital Funds
Non-Recurring Budget Cuts for Both the Operating and Capital Funds
This list represents POTENTIAL reductions for the 2009-2010 school year. No action will be taken until May or June following the Regular Legislative Session.
2001-02 to 2008-09 • The Operating Budget has increased 41% since 2001-02, but if you exclude Class Size Reduction and K-12 Reading state categorical funds, the increase is only 21%. • This equates to a annual increase of 3% over the last 7 years. • Beginning Teacher Salary has increased 27% over the same time period for an average annual increase of 3.9%.
Florida’s Ranking of Per Student Expenditure in the Nation • 2000-01 38th 7,718 • 2001-02 42nd 7,651 • 2002-03 43rd 7,759 • 2003-04 42nd 7,974 • 2004-05 42nd 8,232 • 17% below the nation average of 9,910 • Source: National Center for Education Statistics
This list represents POTENTIAL reductions for the 2009-2010 school year. No action will be taken until May or June following the Regular Legislative Session.
Summary • Assumptions and Non-Recurring Reductions • $66 million • POTENTIAL Reductions – • $66.2 million • Legislative session – • March 3 to May 1 • Board NOT involved until late May/June timeframe • Parents, students, staff, community members, business partners – • Urged to do it NOW! • Or these POTENTIALcuts may become a REALITY!