Download
1 / 26
260 likes | 361 Views
What we found in TTSD. About 30-40 students (per school) who need a comprehensive reading program Middle schools: 1000 students High Schools:2000 students A few students who need to build fluency 120 - 200 students who need comprehension strategy instruction per school

E N D
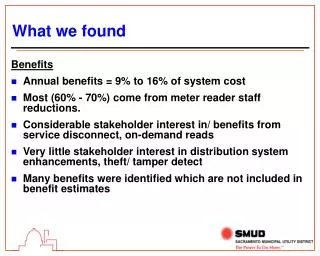
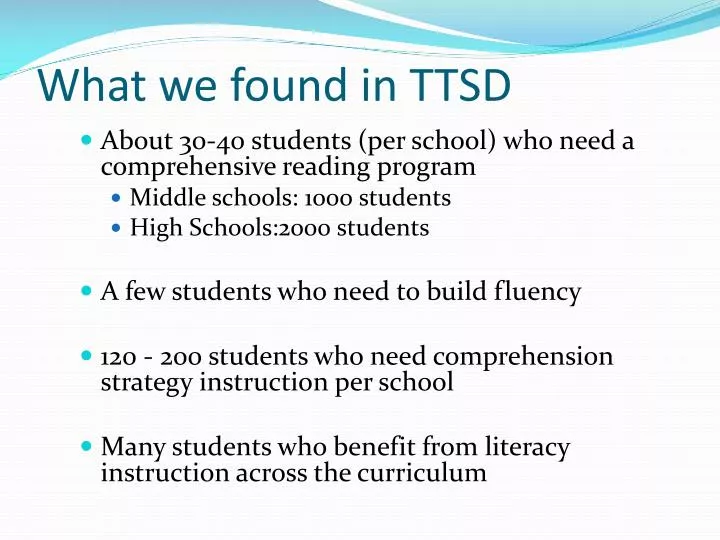
What we found in TTSD • About 30-40 students (per school) who need a comprehensive reading program • Middle schools: 1000 students • High Schools:2000 students • A few students who need to build fluency • 120 - 200 students who need comprehension strategy instruction per school • Many students who benefit from literacy instruction across the curriculum
Curriculum Choices • Language! (Comprehensive Reading & Writing) • Soar to Success (MS Comprehension) • Literacy Strategies Classes (HS Comprehension) • McREL & Beers/Tovani Teaching Reading in the Content Areas
Across the Tiers • All students have access to embedded literacy strategies across content areas • Foci: • Frayer Model • Anticipation Guide • Word Sorts • Active Participation • DR/TA or KWL • Group Summarizing • Definition Word Chart • Differentiated Assessment
Tier I: What do students receive? • General Ed Classes • Access to Content Literacy Strategies • A limited number of students are monitored by the Literacy Specialist Target = 80% of student population
Tier II: What do students receive? • General Ed Classes • Access to Content Literacy Strategies • Strategic Intervention • Soar to Success (Middle School) • Literacy Strategies (High School) • Identify Text Structure • Predictions • Main Idea/Detail • Inferences • Visualization • Summarizing • Definition Word Chart Target = 15% Student Population
Tier III: What do students receive? • Access to Content Literacy Strategies • Comprehensive reading and writing support • LANGUAGE! (High School) • LANGUAGE! (Middle School)
TTSD 6-12 Reading Decision Rules • Screening: • Every student at each grade level who scores in the lowest 20 percent on MAZE, or at or below the 35th percentile on the OAKS, is: • further screened with oral reading fluency measures from 6-Minute Solution (check for fluency & accuracy); then, • the San Diego Quick is administered to evaluate what level of the SRAI to use; then, • the SRAI is administered to gauge comprehension skills; then, • for students with the most comprehensive reading needs, the Language! placement tests are administered. • Progress monitoring (6-12): • Maze-CBM twice monthly.
Reading Decision Rules Continued • Intensifying interventions (These conditions should instigate a discussion in an EBIS meeting at the end of an intervention period): • Maze scores indicate 3 to 4 data points (in a semester) below the aimline AND are below the 50th percentile. • Maze trendline analysis indicates a flat or declining slope AND scores are below the 50th percentile. • Grade+ scores are in the 3rd stanine or below. • Exiting interventions: • Maze scores indicate 3 or more data points above the aimline AND are at or above the 50th percentile; AND, • Grade+ scores are at or above the 5th stanine; AND • OAKS scores are at or above the 36th percentile
Measuring Reading Comprehension with a Cloze Procedure • “Maze” is a multiple-choice “cloze” task that students complete while reading silently for 3 minutes. The first sentence of a 150-400 word passage is left intact. Thereafter, every 6th word is replaced with three words inside parenthesis. One of the words is the exact one from the original passage. The number of correct responses is normed, as is the rate of improvement. • Science-based research has shown that this provides a reliable and valid measure of reading comprehension.
Change the Intervention!!! Intervention: LANGUAGE! D Grade+ Composite Score = 1st Stanine
Intervention Change: Language! Grade+ Composite Score = 1st Stanine
TTSD Standard Behavior ProtocolDecision Rules: • Screening • 6-12 • Office Discipline Referral Data reviewed monthly. If more than 1 major referral per day per month for every 200 students, revisit the CORE and look for patterns in location, time, grade, type, and frequency of incidents. • K-12 • CORE: • If more than 20% of all students received 2 or more referrals: revisit the CORE. • If more than 20% of students are failing, revisit the CORE. • If more than 40% of referrals occur in classrooms: re-teach classroom expectations, increase professional development in classroom management strategies, and/or revisit CORE instruction in specific classrooms. • If more than 30% of referrals occur in a specific area of the school: re-teach specific common area behavior expectations, acknowledge/reward positive behavior, & correct inappropriate behavior immediately.
Behavior Decision Rules, Continued • Strategic: • If more than 2 referrals in a 30-day period, meet with parents and develop a plan. • If more than 5 absences in a 30-day period: instigate communication strategies with families and EBIS team reviews other data to determine appropriate interventions. • If a student has 2 or more F’s or a GPA of <1.4 during any quarter, provide intervention. • If more than 5 referrals, complete an FBA and individualize your interventions. • Progress monitoring: • K/1: 1x/week PSF & Behavior Intervention Data. • K-12: Behavior data from Check and Connect program, referrals, grades and attendance • K-12: Progress on individual behavior goals or Behavior Support Plan. • Intensifying intervention: • If progress is below the expected rate after 4 to 6 weeks of Second Tier Intervention, students move to Third Tier Interventions (consider performing a Functional Behavior Assessment and developing a Behavior Support Plan). • Students receiving 6 or more behavior referrals during the school year - perform an appropriate Functional Behavior Assessment & develop a Behavior Support Plan.
Donald participates in the general curriculum Effective Support Team reviews achievement and behavioral data (school wide) and places Donald in group intervention Donald isn’t doing well Donald probably recycles Donald doesn’t improve Donald improves Effective Support Team conducts Individual Problem Solving Resumes general program Donald may recycle Donald improves Donald doesn’t improve Improvement is good and other factors are suspected as cause Intervention is intense and LD is suspected Special Education referral is initiated Evaluation planning meeting, Procedural safeguards provided, consent obtained, 60 school day timeline starts
Median Reading Comprehension Gain vs. Expected Gain for Students In Secondary Literacy Programs - By Curriculum December 2006 Through May 2007 - Students w/ 3 or more scores only Expected Growth Rate for Students Below the 25th Percentile is .1 Words Per Week
For more information: www.nclack.k12.or.us/Schools.Services/rti/index.htm www.ttsd.k12.or.us/orrti