Download
1 / 36
520 likes | 1.16k Views
Heat Treatment of Carbon and Alloy Steels. Metallurgy for the Non-Metallurgist. Introduction: Heat Treatment of Steel. Iron-carbon phase diagram is a guideline Made possible 1.) FCC to BCC phase transformation 2.) and differing interstitial solubility of carbon

E N D
Heat Treatment ofCarbon and Alloy Steels Metallurgy for the Non-Metallurgist
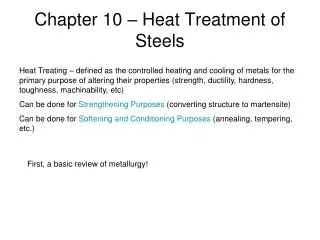
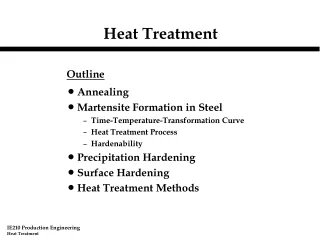
Introduction: Heat Treatment of Steel • Iron-carbon phase diagram is a guideline • Made possible 1.) FCC to BCC phase transformation 2.) and differing interstitial solubility of carbon • Decomposition of austenite (FCC) via solid state reactions: disposition of carbon • Pearlite, Bainite, Martensite, tempered Martensite • Hardness an indicator
Learning Objectives • After completing this lesson, students will be able to: • Describe the austenite transformation processes • List the primary quenching media and their applications • Explain tempering • Classify heat treating furnaces by heat transfer media • Outline the procedure for the Jominy end-quench test for hardenability
Arrangement of atoms in the two crystalline structures of pure iron. (a) Body-centered cubic (bcc) lattice. (b) Face-centered cubic (fcc) lattice. Small sphere in fcc lattice is carbon atom.
Microstructures of carbon steels. (a) Microstructure of a eutectoid steel (all pearlite). Original magnification, 500×. (b) Microstructure of a eutectoid steel with all cementite in the spheroidal form. Original magnification, 1000×. (c) Ferrite (white) outlining prior-austenite grain boundaries and pearlite (gray) in a hypoeutectoid steel. Original magnification, 200×. (d) Microstructure of hypereutectoid steel—pearlite with cementite bounding the prior-austenite grains. Original magnification, 500×
Non-hardening Heat Treatments • Normalizing: just into the austenitizing range for small grains and carbon homogeneity; sometimes two step • Annealing: slow cool, soft pearlite • Recrystallization anneal: short time, applied to cold worked steel, eliminates residual stress • Stress relief anneal: below transformation, reduces residual stress
Isothermal transformation diagram for 1080 steel containing 0.79% C and 0.76% Mn. Specimens were austenitized at 900 °C (1650 °F) and had an austenite grain size of ASTM No. 6. Note the hardness scales on the right vertical axis. This represents the hardness of the structure formed by complete isothermal transformation as a function of temperature.
Microstructures of a 0.90% C steel quenched from 1000 °C (1830 °F) (austenite) to indicated temperature, held until austenite partially transformed, then quenched so that remaining austenite transformed to martensite (white matrix). (a) Coarse pearlite (some proeutectoid cementite has formed in prior austenite grain boundaries). 700 °C (1300 °F). (b) Nodular colonies of very fine pearlite. 600 °C (1110 °F). (c) Feathery “upper” bainite. 450 °C (840 °F). (d) Acicular “lower” bainite. 260 °C (500 °F). Original magnification of all microstructures, 500×
Martensite • Forms plate or lath shaped structure; very small subgrains, highly strained, HARD • Begins forming below MS • MS determined by composition of steel, not affected by cooling rate or grain size • Most alloying elements, esp. C lower MS • MF,Retained austenite • Tempering necessary
Hardness distribution in water-quenched bars of steel (SAE 1045)
Continuous cooling transformation diagram for a steel containing 0.39% C, 0.26% Si, 0.82% Mn, 1.00% Cr, and 0.21% Mo (designated by SAE as 4140) after austenitizing at 845 °C (1550 °F)
Continuous cooling transformation diagram for a steel containing 0.40% C, 0.34% Si, and 0.83% Mn (designated by SAE as 1040) after austenitizing at 790 °C (1455 °F). Also shown are two micrographs of as cooled structures. Both microstructures are pearlitic and the 168 HV microstructure represents soft pearlite.
Continuous cooling transformation diagram for a pipe steel containing 0.46% C, 0.22% Si, 1.55% Mn, and 0.14% Mo (designated as N80) after austenitizing at 845 °C (1550 °F). Also shown are two micrographs of as-cooled structures. The 710 HV structure is martensitic and the 274 HV microstructure is bainitic.
Relationship between carbon content and maximum hardness. Full hardness can be obtained with as little as 0.60% C, as noted by data point.
Relationship between carbon content and maximum hardness usually attained in commercial hardening
Effect of section size on surface hardness of a 0.54% C steel, quenched in water from 830 °C (1525 °F)
Standard end-quench (Jominy) test specimen and method of quenching in quenching jig
Method of developing end-quench curve by plotting hardness vs. distance from quenched end. Hardness is plotted every 6.4 mm (1/4 in.) for clarity, although Rockwell C readings were taken in increments of 1.6 mm (1/16 in.), as shown at the top of illustration.
End-quench hardenability curve for carbon steel, designated by AISI as 1541
Hardenability curves for several alloy steels. (Designations are AISI.)
Hardenability band for an alloy steel, 0.47–0.54% C, 0.65–1.10% Mn, 0.75–1.20% Cr, 0.15–0.25% Mo (designated by AISI as 4150H), normalized at 870 °C (1600 °F) and annealed at 845 °C (1550 °F)
Marquenching: cooling to above the martensite transformation temperature, hold, then quench to minimize cracking Austempering: Holding the steel above the martensite start temperature in a salt bath while forming fine carbides of Bainite
Transformation diagrams and cooling curves for a specific steel (designated by AISI as 8630), indicating the transformation of austenite to other constituents as a function of cooling rate
Effect of tempering temperature on room-temperature hardness and strength of AISI 1050 steel
Effect of time at four tempering temperatures on room-temperature hardness of quenched 0.82% C steel
Heat treating • May introduce quench cracking: chamfer • Hardening(or softening) can be localized • Induction, flame, laser • Atmospheres can be natural, carburizing, decarburizing, neutral, inert • Fluidized bed about ten times faster than usual gases
Summary: Heat Treatment of Steels • Heating/cooling to affect properties • Iron-carbon very responsive • Equilibrium phase diagram initial guideline • Consult CCT curves for specific alloys • Hardness differs from hardenability • Heat treatment of cast irons analogous but slower