Download

1 / 20
200 likes | 372 Views
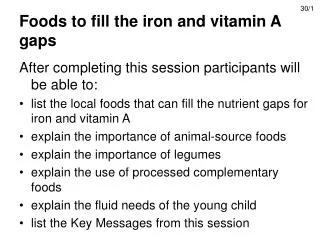
Iron and Vitamin B1. 陳慧君 10-21-91. Iron. Introduction. The most common deficiency of a single nutrient in both the developing and the developed world

E N D
Iron and Vitamin B1 陳慧君 10-21-91
Iron Introduction • The most common deficiency of a single nutrient in both the developing and the developed world • Dietary iron requirements are determined by blood loss( including menstrual blood loss) and the needs of growth in children, adolescents, and pregnant women. • Reduced body iron stores may be caused by inadequate dietary iron, excessive blood loss, or both.
Iron • The absorption of heme iron being much less efficiently regulated. Absorption of non-heme iron is influenced by other dietary factors. • Biochemical data are a poor indication of dietary intake for individuals without substantial additional information about other dietary components, growth requirements, and blood loss.
Serum Ferritin • Ferritin is the principal iron storage protein. • Serum ferritin level provides the best single indicator of iron stores. • Average within-subject CV% =14.5% within-assay CV% = 4.3% • Ferritin is decreased in proportion to the frequency of phlebotomy. • Ferritin is increased in proportion to supplementation and iron overload.
Serum Ferritin • Significant correlation between total daily iron intake and serum ferritin was not significantly observed. • Meat intake was a significant predictor of serum ferritin level( a measure of heme iron).
Serum Iron • Serum iron level is highly variable, and changes of more than 20% have been observed within 10 minutes among healthy subjects. an unreliable long-term measure
Transferrin Saturation and Total Iron-Binding Capacity • Transferrin saturaiton = Serum iron TIBC • TIBC is relatively stable, transferrin saturation is determined principally by changes in the serum iron concentration and is equally subject to short-term variation.
Erythrocyte Protoporphyrin • Iron deficiency impaired heme synthesis and accumulation of protoporphyrin, a heme precursor, in erythrocytes. • Measurement of EP level is a sensitive indicator of iron deficiency, but provides no information about iron overload.
Erythrocyte Protoporphyrin • EP is good for large-scale surveys: 1. small sample size(20ul blood) 2. the relative simplicity 3. reproducibility of the measurement • EP value <35 mg/dl, 88% sensitivity and 90% specificity as compared with serum ferritin. Correlation of EP with serum ferritin =0.66
Mean Corpuscular Volume • Microcytosis of RBC can caused by thalassemia and inflammation. • It is only a morphologic indicator of iron deficiency. Hemoglobin or Hematocrit • More severe and long-standing iron deficiency reduced Hb level. • Over hydration, hemoglobinopathies, Vit B12 deficiency and chronic diseases also caused lower Hb level.
Hair and Nails • The method may be a measure for patient with hemochromatosis, but gives little information about levels over the normal range of iron intake. • The biological significance of iron in hair and nails remains to be determined.
Other Determinants • The major determinant of iron blood loss • Blood donations and menstrual history should be considered in interpretation of iron status. • Oral contraceptive users reduced menstrual blood loss
Summary • The use of several biochemical indicators of iron status provides a more sensitive and specific assessment . • The appropriate cut-off values should be carefully determined to categorize subjects according to diagnostic groups.
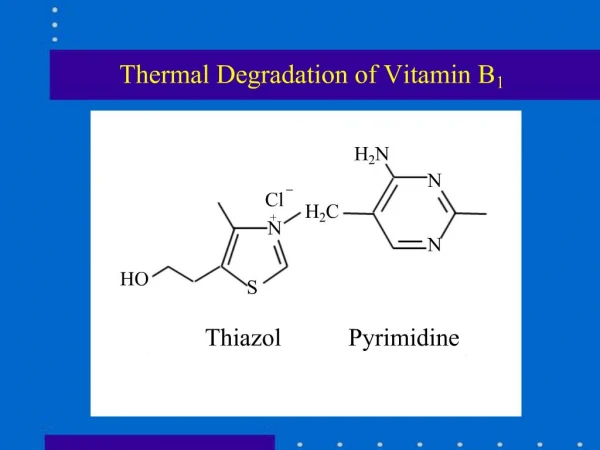
Vitamin B1 • 5% U.S. adults over 60 years old impaired thiamin status • The prevalence among the poor, the chronically ill, the institutionalized.
Vitamin B1 • The best method for assessing thiamine nutriture in the population is the stimulation of erythrocyte transketolase by thiamine pyrophosphate(TPP) • Transketolase activity after addition of TPP Transketolase activity before addition of TPP • Greater than 1 imply deficiency of endogenous thiamine
Vitamin B1 • Development of automated procedures make this method more applicable to large studies. • Little sample(50ul whole blood) is required for the calorimetric method. • Correlation between calorimetric method and FFQ for thiamin intake is 0.02.
Vitamin B1 • HPLC is a precise technique for measuring vitamin B1 in plasma and whole blood, but not a useful measure of thiamine status. (Thiamin deficiency does not cause a large reduction in blood level.) • Urinary thiamin level is not a good index of thiamine nutriture.
Vitamin B1 • Automatically measuring RBC transketolase stimulation provide reproducible and sensitive results.(2.7% within-run;4.1% between-run) • Long-term stability of RBC transketolase is uncertain.
Vitamin B1 • Measurement of Other Determinants: DM and polyneuritis low RBC transketolase activity • Pernicious anemia high activity • Heavy alcohol intake inhibit : thiamine absorption and metabolism


![Thiamine Mononitrate [Vitamin B1] Market](https://cdn5.slideserve.com/9965687/thiamine-mononitrate-vitamin-b1-market-to-reach-dt.jpg)