Download
1 / 1
10 likes | 146 Views
Kyle Dietrich ENVS 400 Spring 2014. Challenges to Urban Park Funding in Portland, Oregon.

E N D
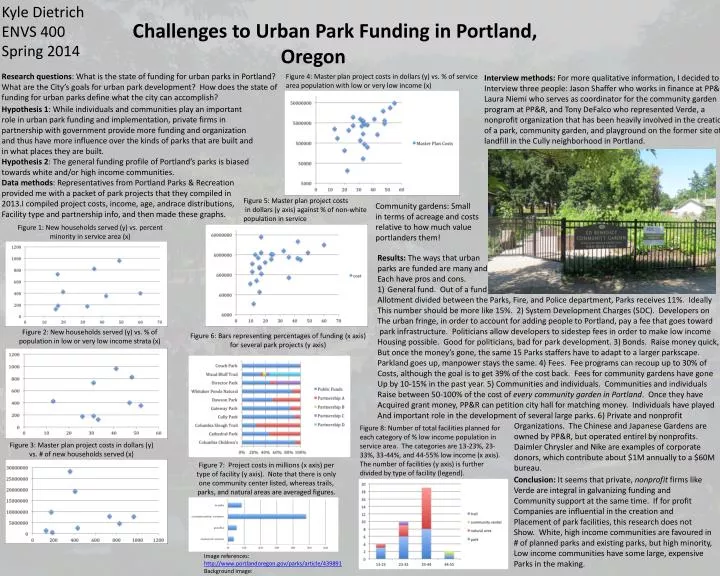
Kyle Dietrich ENVS 400 Spring 2014 Challenges to Urban Park Funding in Portland, Oregon Research questions: What is the state of funding for urban parks in Portland? What are the City’s goals for urban park development? How does the state of funding for urban parks define what the city can accomplish? Figure 4: Master plan project costs in dollars (y) vs. % of service area population with low or very low income (x) Interview methods: For more qualitative information, I decided to Interview three people: Jason Shaffer who works in finance at PP&R, Laura Niemi who serves as coordinator for the community garden program at PP&R, and Tony DeFalco who represented Verde, a nonprofit organization that has been heavily involved in the creation of a park, community garden, and playground on the former site of a landfill in the Cully neighborhood in Portland. Hypothesis 1: While individuals and communities play an important role in urban park funding and implementation, private firms in partnership with government provide more funding and organization and thus have more influence over the kinds of parks that are built and in what places they are built. Hypothesis 2: The general funding profile of Portland’s parks is biased towards white and/or high income communities. Data methods: Representatives from Portland Parks & Recreation provided me with a packet of park projects that they compiled in I compiled project costs, income, age, andrace distributions, Facility type and partnership info, and then made these graphs. Figure 5: Master plan project costs in dollars (y axis) against % of non-white population in service Community gardens: Small in terms of acreage and costs relative to how much value portlanders them! Figure 1: New households served (y) vs. percent minority in service area (x) Results: The ways that urban parks are funded are many and Each have pros and cons. General fund. Out of a fund Allotment divided between the Parks, Fire, and Police department, Parks receives 11%. Ideally This number should be more like 15%. 2) System Development Charges (SDC). Developers on The urban fringe, in order to account for adding people to Portland, pay a fee that goes toward park infrastructure. Politicians allow developers to sidestep fees in order to make low income Housing possible. Good for politicians, bad for park development. 3) Bonds. Raise money quick, But once the money’s gone, the same 15 Parks staffers have to adapt to a larger parkscape. Parkland goes up, manpower stays the same. 4) Fees. Fee programs can recoup up to 30% of Costs, although the goal is to get 39% of the cost back. Fees for community gardens have gone Up by 10-15% in the past year. 5) Communities and individuals. Communities and individuals Raise between 50-100% of the cost of every community garden in Portland. Once they have Acquired grant money, PP&R can petition city hall for matching money. Individuals have played And important role in the development of several large parks. 6) Private and nonprofit Organizations. The Chinese and Japanese Gardens are owned by PP&R, but operated entirel by nonprofits. Daimler Chrysler and Nike are examples of corporate donors, which contribute about $1M annually to a $60M bureau. Figure 2: New households served (y) vs. % of population in low or very low income strata (x) Figure 6: Bars representing percentages of funding (x axis) for several park projects (y axis) Figure 8: Number of total facilities planned for each category of % low income population in service area. The categories are 13-23%, 23-33%, 33-44%, and 44-55% low income (x axis). The number of facilities (y axis) is further divided by type of facility (legend). Figure 3: Master plan project costs in dollars (y) vs. # of new households served (x) Figure 7: Project costs in millions (x axis) per type of facility (y axis). Note that there is only one community center listed, whereas trails, parks, and natural areas are averaged figures. Conclusion: It seems that private, nonprofit firms like Verde are integral in galvanizing funding and Community support at the same time. If for profit Companies are influential in the creation and Placement of park facilities, this research does not Show. White, high income communities are favoured in # of planned parks and existing parks, but high minority, Low income communities have some large, expensive Parks in the making. Image references: http://www.portlandoregon.gov/parks/article/439891 Background image: