Download
1 / 3
30 likes | 137 Views
Correlation and Line of Best Fit Maths HL. By Joseph Harley 9G. Correlation. If the points on a graph increase in value on the Y axis as they go along the X axis, then a graph has ‘positive correlation’, like the one shown top left.

E N D
Correlation and Line of Best Fit Maths HL By Joseph Harley 9G
Correlation If the points on a graph increase in value on the Y axis as they go along the X axis, then a graph has ‘positive correlation’, like the one shown top left. If the points decrease in value on the Y axis as they go along the X axis then a graph has ‘negative correlation’(see bottom left). If there is no pattern then the graph has ‘no correlation’(see bottom right).
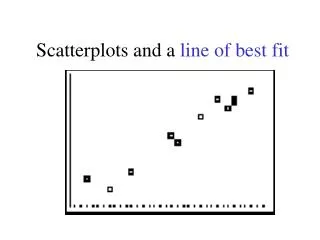
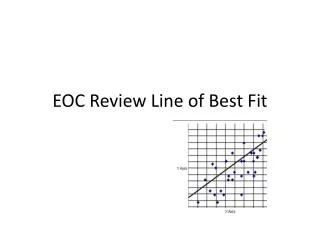
Line of Best Fit The Line of Best Fit is a line drawn on a scatter graph that goes through the maximum number of points. Therefore the Line of Best Fit on the graph on this slide is: