Download

1 / 82
820 likes | 954 Views
presents A Global Look at Ag Markets & the Delmarva by Dan Manternach, Director of Operations Doane Advisory Services, St. Louis, MO dmanternach@doane.com Jan. 31, 2014 Black Diamond Lodge, Fruitland MD. I. Trends and geopolitics shaping global agriculture since 2008.

E N D
presentsA Global Look at Ag Markets & the Delmarvaby Dan Manternach, Director of OperationsDoane Advisory Services, St. Louis, MOdmanternach@doane.comJan. 31, 2014Black Diamond Lodge, Fruitland MD
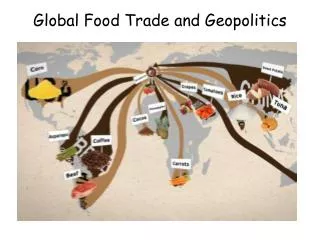
I. Trends and geopolitics shaping global agriculture since 2008.
So what launched the “new era” for ag prices?? • A global shortage of wheat in 2008 due to unprecedented crop problems in all five major global wheat exporting regions. • Usage of corn for ethanol began to skyrocket due to RFS standards and was not subject to normal “price rationing”. • Steady growth in per capita incomes for China, India and other SE Asian countries had fueled rapid growth in food demand. • China adopted a new definition of “self sufficiency” in food production which made large-scale imports part of it! • The global “protein gap” in per capita consumption of protein from all sources (meat, poultry, eggs, fish and dairy)
Global Per Capita Grain Consumption(pounds per person per year) Per capita consumption is up about 6% since the early 2000s Remember growth in the U.S. ethanol production was a big deal
II. Today’s farmland market: Still Booming? …OrBubble about to burst?
Land with Expiring CRP Contracts(thousand acres) * Sign-up to renew was held in May and June via bids. * 1.9 million offered for re-enrollment; 1.6 million accepted by USDA. * Remaining 1.7 million will come back into production for 2014. * 25.3 million will remain in CRP; down from 31.1 million in 2011.
World grain Yieldstonnes per hectare Yield rising at 1.3% per year Population rising at 1.12% per year
Rents & land values rose for 2013,but rent:value ratio declined slightly
There are only four ways rent:value ratios can climb from historic lows: 1)The rise in land values can slow dramatically, relative to rising rents; percentage-wise. 2) Rents can accelerate their rate of growth while land values increase at a steady rate. 3) Land values could stall or even decline slightly while rents remain firm to higher. 4)Both land and rents could begin to slip, with land falling harder, percentage-wise.
This key ERS “barometer” shows current farm real estate can cash-flow again – but barely
About 25% of ag real estate value impacted by proximity to large urban areas; but only 7% with “high” impact (note USDA’s data current only through 2008, however)
Key distance element seems to be 10 mi., regardless of size of metro area
Proximity to Interstate Highways as a factor in farm real estate values highly dependent on level of influence by size of metro area; i.e. the value for potential commercial/residential development
Evident even rural housing values peaked in ‘06, in sync with urban values
Non-operator owners still a minority and important to remember many are retired farmers (or their widows)
Foreign ownership has picked only slightly – except for forestlands
What “Data Dashboard” Gauges Tell You About Key Trends Affecting Crop Prices: Gauge #1: U.S. carryover expressed in days’ supply. This tells you how long projected U.S. ending stocks will last at the current rate of usage and export. Gauge # 2: Global stocks:use ratio. This tells you how big global stocks are relative to the current rate of global usage. Gauge #3: Exporter stocks:trade ratio. Often traders are less concerned about the actual level of projected ending stocks as they are with who will hold them. So long as traders see export competitor stocks steady to rising as a percentage of global trade, they don’t get overly alarmed.
Interpreting “Dashboard Gauges” (continued from previous slide) Gauge #4:Global stocks trade ratio. Usually this is secondary to the global stocks: use ratio in terms of price impact. But sometimes, the trend in the ratio of global stocks to global trade is more significant than the ratio of stocks to overall usage because it takes higher prices to limit export trade, whereas reduced availability alone can limit domestic usage. Gauge #5: Importer production:use ratio. This gauge keeps track of production in major importing countries relative to use. When their production drops relative to usage, they have to import more to maintain that usage. If instead the ratio is trending higher, it means less import demand is likely from these key markets.
US Corn Trend has been down (bullish) since Julyin Days’ Supply
Trend had been higher until December, then down (bullish) Ratio