Download

1 / 51
520 likes | 657 Views
Learn about plasma removal process chemistry, sidewall passivation, recipe parameters analysis, and modeling etch profiles. Understand balancing chemistry and bombardment to control etching rates and achieve ideal sidewall profiles. Explore the Egg Chart for material etching considerations.

E N D
Outline • Introduction • Models to understand the plasma process • Chemistry • Analyzing recipe parameters, and the resultant etch profiles • Endpoint
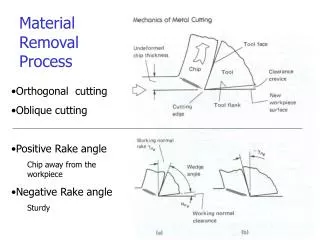
Sidewall Passivation • Sidewall passivation can be used in an etch process to control sidewall profile • A film forms on the sidewalls, preventing the material from being etched isotropically • The film is actually a polymer formed from the process gases and the photoresist layer on the substrate • The polymers are basically combinations of carbon and hydrogen. May contain oxygen and nitrogen and other etch byproducts. Polymer chemistry depends on process conditions. • Specific gases can be added to the recipe to insure passivation film formation
Etch Profile with Sidewall Passivation Radicals: reactive etching species Reaction Products: volatile etch products Film formers: provide sidewall passivation, photoresist can be a large contributor Positive ions: provide physical bombardment on surface, breaking surface film formers at bottom, physically etching and providing energy to help drive chemical reactions Public Domain: Image Generated by CNEU Staff for free use
Sidewall Passivation Polymers coat the sidewalls and act as a “pseudo-mask” for protection from chemical attack Ions, for the most part, strike vertically and remove polymer buildup at the bottom of the etch The sidewall polymers are removed by using O2 plasma at 500-750mT This exposure uses a lot of chemistry and little bombardment
Outline • Introduction • Models to understand the plasma process • Chemistry • Analyzing recipe parameters, and the resultant etch profiles • Endpoint
Controlling the Etch Process by Balancing Chemistry and Bombardment • In dry etch processes choosing the correct chemistries can greatly increase the etch rate • Increasing MFP of the plasma (decreasing the pressure) also increases the etch rate, this will aid uniformity • Combining chemistry and bombardment will produce an etch rate that is greater than either contributor alone • Combining chemistry and bombardment allows the profile to be “tuned” between isotropic and anisotropic • The etch profile can also be enhanced with side wall passivation
Some Materials and Selected Etchants Material Chemistry Material Chemistry
Outline • Introduction • Models to understand the plasma process • Chemistry • Analyzing recipe parameters and the resultant etch profiles • Endpoint
The “Egg” Chart • This analytical model is a graphical representation of various process parameters. The Y axis represents bombardment energy, the X axis represents chemical energy, and the “dog leg” boundary represents polymer formation. • For an ideal anisotropic etch, the required parameter zone resembles an “egg” in the middle of the chart • This chart shows the combined effects of chemistry, bombardment, and polymerization (C*B+P) to predict sidewall profiles • There are also other factors that determine the etch profile that are not included in this exercise. These parameters will be discussed after this first iteration analysis.
The “Egg” Chart • A chart like this can be found and/or generated for any dry etchable material • Due to its wide use in micro and nanofabrication, we will analyze the egg chart for SiO2 • Naturally this chart is not “exact”, but can be used as a starting point for building a etch recipe.
Oxide Egg Chart Considerations • F/C Ratio- the ratio of fluorine to carbon etching species • Increasing DC bias, increases bombardment • The addition of H2 to the chamber increases polymerization • The addition of O2 to the chamber increases free fluorine • Aspect Ratio- the ratio of depth to width for a small gap, trench, or hole
Fluorine to Carbon Ratio (F/C) of Gas Phase Etching Species vs DC Bias Level High C2F4 C4F10 C2F6 CF4 Etching Bias Applied to Surface (Volts) DC Bias O2 Addition Loading Polymerization H2 Addition Low 4 0 1 2 3 F/C Ratio Public Domain: Image Generated by CNEU Staff for free use
Fluorine to Carbon Ratio (F/C) of Gas Phase Etching Species vs DC Bias Level High C2F4 C4F10 C2F6 CF4 Etching 1 Bias Applied to Surface (Volts) DC Bias O2 Addition Loading Polymerization H2 Addition Low 4 0 1 2 3 F/C Ratio Public Domain: Image Generated by CNEU Staff for free use
The Ideal Profile • To be “in the egg” is to achieve the ideal anisotropic etch • The ideal F/C ratio is approximately 2 • An equal mix of hydrogen and oxygen to balance polymerization and etch • DC bias level that provides just enough bombardment
The Ideal Profile W D Public Domain: Image Generated by CNEU Staff for free use
Sidewall Profile Two • Low DC bias – little/no bombardment • No H2 - no polymerization • A lot of O2 – can increase etching • F/C ratio = 4, SiF4 is formed • Aspect ratio < 1, an isotropic etch profile
Fluorine to Carbon Ratio (F/C) of Gas Phase Etching Species vs DC Bias Level High C2F4 C4F10 C2F6 CF4 Etching Bias Applied to Surface (Volts) DC Bias O2 Addition Loading Polymerization H2 Addition 2 Low 4 0 1 2 3 F/C Ratio Public Domain: Image Generated by CNEU Staff for free use
Sidewall Profile Two Public Domain: Image Generated by CNEU Staff for free use
Sidewall Profile Three • Low DC bias – no bombardment • A lot of H2 - a lot of polymerization • No O2 – no etch • F/C = 1/3, SiF4 is not formed
Fluorine to Carbon Ratio (F/C) of Gas Phase Etching Species vs DC Bias Level High C2F4 C4F10 C2F6 CF4 Etching Bias Applied to Surface (Volts) DC Bias O2 Addition Loading Polymerization 3 H2 Addition Low 4 0 1 2 3 F/C Ratio Public Domain: Image Generated by CNEU Staff for free use
Sidewall Profile Three Polymer buildup Public Domain: Image Generated by CNEU Staff for free use
Sidewall Profile Four • High DC bias – high bombardment • No H2 – no polymerization • A lot of O2 – high etch • F/C ratio = 4, SiF4 is formed • Aspect ratio >1, a dry etch profile
Fluorine to Carbon Ratio (F/C) of Gas Phase Etching Species vs DC Bias Level High C2F4 C4F10 C2F6 CF4 4 Etching Bias Applied to Surface (Volts) DC Bias O2 Addition Loading Polymerization H2 Addition Low 4 0 1 2 3 F/C Ratio Public Domain: Image Generated by CNEU Staff for free use
Sidewall Profile Four 3 6 Sharp angles due to high bombardment with no polymerization Public Domain: Image Generated by CNEU Staff for free use
Sidewall Profile Five • High DC bias – high bombardment • A lot of H2 – a lot of polymerization • No O2 – no etch • F/C ratio =1/5, SiF4 is not formed • Aspect ratio > 1, Dry etch profile with undesirable features
Fluorine to Carbon Ratio (F/C) of Gas Phase Etching Species vs DC Bias Level High C2F4 C4F10 C2F6 CF4 5 Etching Bias Applied to Surface (Volts) DC Bias O2 Addition Loading Polymerization H2 Addition Low 4 0 1 2 3 F/C Ratio Public Domain: Image Generated by CNEU Staff for free use
Sidewall Profile Five Jagged features due to polymer buildup Public Domain: Image Generated by CNEU Staff for free use
Sidewall Profile Six • Medium DC bias – medium bombardment • No H2 – no polymerization • A lot of O2 – high etch • F/C = 4, SiF4 is formed • Aspect ratio < 1, a wet etch profile
Fluorine to Carbon Ratio (F/C) of Gas Phase Etching Species vs DC Bias Level High C2F4 C4F10 C2F6 CF4 Etching Bias Applied to Surface (Volts) DC Bias 6 O2 Addition Loading Polymerization H2 Addition Low 4 0 1 2 3 F/C Ratio Public Domain: Image Generated by CNEU Staff for free use
Sidewall Profile Six Wider and deeper than profile one due to increased bombardment Public Domain: Image Generated by CNEU Staff for free use
Sidewall Profile Seven • Medium DC bias – medium bombardment • A lot of H2 – a lot of polymerization • No O2 – no etch • F/C ratio = ¼, SiF4 is not formed • Aspect ratio > 1, Dry etch profile with undesirable features
Fluorine to Carbon Ratio (F/C) of Gas Phase Etching Species vs DC Bias Level High C2F4 C4F10 C2F6 CF4 Etching 7 Bias Applied to Surface (Volts) DC Bias O2 Addition Loading Polymerization H2 Addition Low 4 0 1 2 3 F/C Ratio Public Domain: Image Generated by CNEU Staff for free use
Sidewall Profile Seven Less bombardment than profile four Public Domain: Image Generated by CNEU Staff for free use
Considerations Beyond the Egg Chart • The “egg chart” is a useful first approximation to define some process parameters, but it does not cover some important considerations. • We will discuss 4 additional considerations: • Residence time • Microloading • Proximity effect • Post etch evaluation
Residence Time • The average time gas is present in the chamber (seconds) • The residence time is a balance of the pressure, input gas flow, and the pump efficiency • Naturally the residence time will impact the etch process, because etch chemistry and byproducts are constantly being pumped away at a certain rate
Microloading • The change in local etch rate relative to the whole area of material being etched • A large area will load the etching process with volatile etch products, slowing the etch down in that area while a smaller etch area proceeds at a faster rate • Etch rates change according to pattern and exposed area
Microloading Photoresist on top of Wafer Patterned holes in the PR where etching of the wafer occurs Larger area loading the process with removed material- less etching gas relative to area More etching gas relative to area- etches quicker Public Domain: Image Generated by CNEU Staff for free use
SiF4 SiF4 F F Si Si Si Si “Crowded”- harder to remove byproducts, slower etch rate Easier to remove byproducts, faster etch rate Proximity Effect- Etch Rate Based on Feature Size Public Domain: Image Generated by CNEU Staff for free use
Etch Evaluation • Process quality parameters: • Etch rate, selectivity, uniformity • Sidewall Profile • Loss or gain of critical dimensions • Corrosion (in metal etch) • Reproducibility
Outline • Introduction • Models to understand the plasma process • Chemistry • Analyzing recipe parameters, and the resultant etch profiles • Endpoint
Endpoint Detection • General term describing when an etch process has finished • Two common methods of detection • Optical emission • Mass spectroscopy
Optical Emission • Each volatile etch product emits a specific wavelength • The wavelength intensity shows the relative amounts of products being formed • A decrease in intensity corresponds to a decrease in etch products.
RIE With Optical Endpoint Detector Endpoint Detector Oxford Instruments Plasmalab System 100 Public Domain: Image Generated by CNEU Staff for free use
Endpoint detection Normal etch Change in etch rate - detection occurs here. Etch Parameter Endpoint signal stops the etch. Time Example Graph of Optical Endpoint Detection Public Domain: Image Generated by CNEU Staff for free use
Mass Spectroscopy • This method of endpoint detection measures the mass/charge ratio of the etch products • As the mass/charge ratio peak declines, the products being generated by the etch decline due to the material being etched away • A residual gas analyzer is a mass spectrometer
Mass Spectrometer Schematic Detector Steering magnets A Particle Accelerator Ionizing electron stream Public Domain: Image Generated by CNEU Staff for free use