Download
1 / 4
40 likes | 62 Views
The Reserve Bank of India RBI is Indias central bank. Though public sector banks currently dominate the banking industry, numerous private and foreign banks exist. Indias government owned banks dominate the market. Their performance has been mixed, with a few being consistently profitable. Several public sector banks are being restructured, and in some the government either already has or will reduce its ownership. India has an extensive banking network, in both urban and rural areas. All large Indian banks are nationalized, and all Indian financial institutions are in the public sector. The RBI has granted operating approval to a few privately owned domestic banks of these many commenced banking business. Foreign banks operate more than 150 branches in India. B. Nisha "A Study on Beta Analysis of Banking Sectors Listed in NSE" Published in International Journal of Trend in Scientific Research and Development (ijtsrd), ISSN: 2456-6470, Volume-3 | Issue-2 , February 2019, URL: https://www.ijtsrd.com/papers/ijtsrd18978.pdf Paper URL: https://www.ijtsrd.com/management/other/18978/a-study-on-beta-analysis-of-banking-sectors-listed-in-nse/b-nisha<br>

E N D
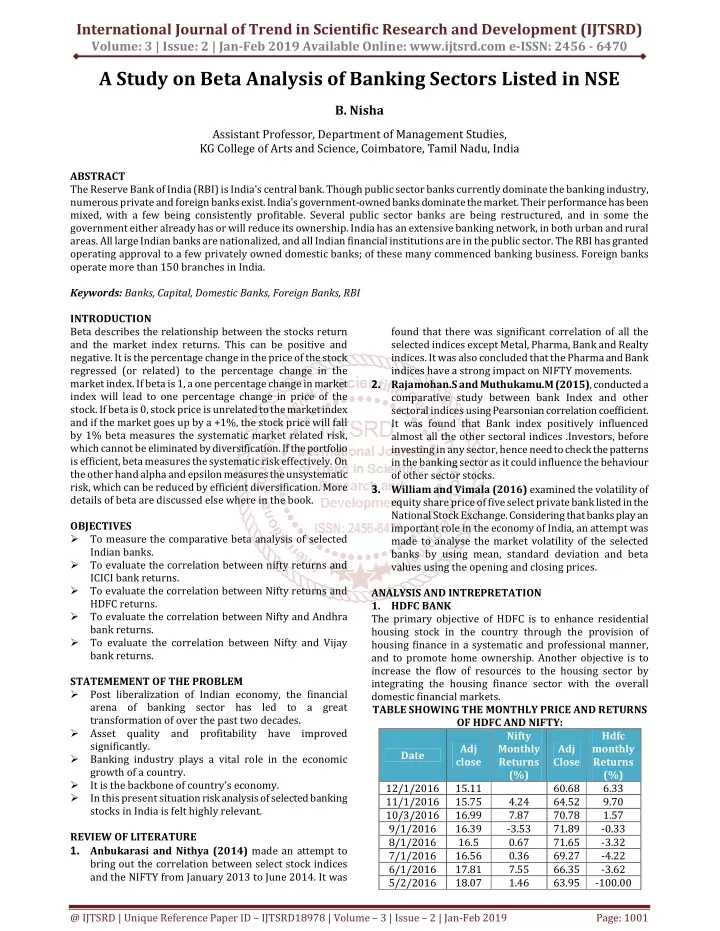
International Journal of Trend in Scientific Research and Development (IJTSRD) Volume: 3 | Issue: 2 | Jan-Feb 2019 Available Online: www.ijtsrd.com e-ISSN: 2456 - 6470 A Study on Beta Analysis of Banking Sectors Listed in NSE B. Nisha Assistant Professor, Department of Management Studies, KG College of Arts and Science, Coimbatore, Tamil Nadu, India ABSTRACT The Reserve Bank of India (RBI) is India's central bank. Though public sector banks currently dominate the banking industry, numerous private and foreign banks exist. India's government-owned banks dominate the market. Their performance has been mixed, with a few being consistently profitable. Several public sector banks are being restructured, and in some the government either already has or will reduce its ownership. India has an extensive banking network, in both urban and rural areas. All large Indian banks are nationalized, and all Indian financial institutions are in the public sector. The RBI has granted operating approval to a few privately owned domestic banks; of these many commenced banking business. Foreign banks operate more than 150 branches in India. Keywords: Banks, Capital, Domestic Banks, Foreign Banks, RBI INTRODUCTION Beta describes the relationship between the stocks return and the market index returns. This can be positive and negative. It is the percentage change in the price of the stock regressed (or related) to the percentage change in the market index. If beta is 1, a one percentage change in market index will lead to one percentage change in price of the stock. If beta is 0, stock price is unrelated to the market index and if the market goes up by a +1%, the stock price will fall by 1% beta measures the systematic market related risk, which cannot be eliminated by diversification. If the portfolio is efficient, beta measures the systematic risk effectively. On the other hand alpha and epsilon measures the unsystematic risk, which can be reduced by efficient diversification. More details of beta are discussed else where in the book. OBJECTIVES ?To measure the comparative beta analysis of selected Indian banks. ?To evaluate the correlation between nifty returns and ICICI bank returns. ?To evaluate the correlation between Nifty returns and HDFC returns. ?To evaluate the correlation between Nifty and Andhra bank returns. ?To evaluate the correlation between Nifty and Vijay bank returns. STATEMEMENT OF THE PROBLEM ?Post liberalization of Indian economy, the financial arena of banking sector has led to a great transformation of over the past two decades. ?Asset quality and profitability have improved significantly. ?Banking industry plays a vital role in the economic growth of a country. ?It is the backbone of country’s economy. ?In this present situation risk analysis of selected banking stocks in India is felt highly relevant. REVIEW OF LITERATURE 1.Anbukarasi and Nithya (2014) made an attempt to bring out the correlation between select stock indices and the NIFTY from January 2013 to June 2014. It was found that there was significant correlation of all the selected indices except Metal, Pharma, Bank and Realty indices. It was also concluded that the Pharma and Bank indices have a strong impact on NIFTY movements. 2.Rajamohan.S and Muthukamu.M (2015), conducted a comparative study between bank Index and other sectoral indices using Pearsonian correlation coefficient. It was found that Bank index positively influenced almost all the other sectoral indices .Investors, before investing in any sector, hence need to check the patterns in the banking sector as it could influence the behaviour of other sector stocks. 3.William and Vimala (2016) examined the volatility of equity share price of five select private bank listed in the National Stock Exchange. Considering that banks play an important role in the economy of India, an attempt was made to analyse the market volatility of the selected banks by using mean, standard deviation and beta values using the opening and closing prices. ANALYSIS AND INTREPRETATION 1.HDFC BANK The primary objective of HDFC is to enhance residential housing stock in the country through the provision of housing finance in a systematic and professional manner, and to promote home ownership. Another objective is to increase the flow of resources to the housing sector by integrating the housing finance sector with the overall domestic financial markets. TABLE SHOWING THE MONTHLY PRICE AND RETURNS OF HDFC AND NIFTY: Nifty Monthly Returns (%) 12/1/2016 15.11 11/1/2016 15.75 4.24 10/3/2016 16.99 7.87 9/1/2016 16.39 -3.53 8/1/2016 16.5 0.67 7/1/2016 16.56 0.36 6/1/2016 17.81 7.55 5/2/2016 18.07 1.46 Hdfc monthly Returns (%) 6.33 9.70 1.57 -0.33 -3.32 -4.22 -3.62 -100.00 Adj close Adj Close Date 60.68 64.52 70.78 71.89 71.65 69.27 66.35 63.95 @ IJTSRD | Unique Reference Paper ID – IJTSRD18978 | Volume – 3 | Issue – 2 | Jan-Feb 2019 Page: 1001
International Journal of Trend in Scientific Research and Development (IJTSRD) @ www.ijtsrd.com eISSN: 2456-6470 CHART SHOWING THE MONTHLY PRICE AND RETURNS OF HDFC AND NIFTY: CHART SHOWING THE PRICE, RETURNS AND BETA VALUES OF HDFC AND NIFTY: The above chart shows the changes in monthly beta values of HDFC and nifty , where in month of 3, the beta value is -1.88 which is negative. So there was low risk compared to other months and can be expected high returns. 2.ANDHRA BANK Andhra Bank was founded by Dr.Bhogaraju Pattabhi Sitaramayya. The bank commenced business on 28th November 1923 with a paid up capital of Rs 1 lakh and an authorised capital of Rs 10 lakh. Andhra Bank has a network of 1713 Business Delivery Channels, consisting of 1,179 branches, 142 Extension Counters, 354 ATMs and 38 Satellite Branches spread over 21 States and 2 Union Territories as at the end of September 2005. The above table and chart depicts the monthly price and return of HDFC and NSE NIFTY during the period of May(2016)-Dec(2016).By looking at the chart it can be observed that there exist a randomness in the returns of HDFC and NSE NIFTY. During the month of November (2016),there was a sudden surge in the returns of the market, However there is a little impact on the stock price, this may because of low correlation between HDFC and NSE NIFTY. TABLE SHOWING THE MONTHLY PRICE AND RETURNS OF ANDHRA BANK Date Adj closeNifty Monthly Returns(%)Adj CloseAndhra Monthly Return(%)Beta Values 12/1/2016 15.11 11/1/2016 15.75 4.24 10/3/2016 16.99 7.87 9/1/2016 16.39 -3.53 8/1/2016 16.5 0.67 7/1/2016 16.56 0.36 6/1/2016 17.81 7.55 5/2/2016 18.07 1.46 CHART SHOWING THE MONTHLY PRICE,RETURNS OF ANDHRA BANK AND NIFTY: 47.5 51.85 56.2 56.45 60.25 60 55.7 49.4 9.16 8.39 0.44 6.73 -0.41 -7.17 -11.31 -100.00 0.96 1.12 1.45 1.34 0.85 0.95 0.96 0.96 CHART SHOWING THE MONTHLY PRICE,RETURNS AND BETA VALUES OF ANDHRA BANK AND NIFTY: The above chart shows the changes in monthly beta values of Andhra Bank , where in month of 6 &7 the beta value is-1.00 which is negative. So there was high risk compared to other months and can be expected low returns. 3.VIJAYA BANK Vijaya Bank was established on 23rd October 1931 by late Shri A. B. Shetty and other enterprising farmers in Mangalore, Karnataka. The objective behind establishment of the Bank was essentially to promote banking habit, thrift and entrepreneurship among the farming community of Dakshina Kannada district in Karnataka State. The bank became a scheduled bank in 1958. During 1963-68, nine The above table and chart depicts the monthly price and return of ANDHRA BANK and NSE NIFTY during the period of May(2016)-Dec(2016).By looking at the chart it can be observed that there exist a randomness in the returns of ANDHRA BANK and NSE NIFTY. During the day 2nd of December (2016),there was a sudden decline in the returns of the market, However there is a little impact on the stock price, this may because of low correlation between ANDHRA BANK and NSE NIFTY. @ IJTSRD | Unique Reference Paper ID – IJTSRD18978 | Volume – 3 | Issue – 2 | Jan-Feb 2019 Page: 1002
International Journal of Trend in Scientific Research and Development (IJTSRD) @ www.ijtsrd.com eISSN: 2456-6470 smaller banks merged with Vijaya Bank and the Bank steadily grew into a large All India bank. Vijaya Bank was nationalized on April 15, 1980 and today the Bank has a network of 913 branches that span all 28 states and 3 union territories in the country. TABLE SHOWING THE MONTHLY PRICE AND RETURNS OF VIJAYA BANK MONTHLY RETURNS: Date Adj closeNifty Monthly Returns(%)Adj CloseAndhra Monthly Return(%)Beta Values 12/1/2016 15.11 4 11/1/2016 15.75 4.24 10/3/2016 16.99 7.87 9/1/2016 16.39 -3.53 8/1/2016 16.5 0.67 7/1/2016 16.56 0.36 6/1/2016 17.81 7.55 5/2/2016 18.07 1.46 CHART SHOWING MONTHLY THE PRICE AND RETURNS OF VIJAYA BANK AND NIFTY: 47.45 44.5 44.25 40.7 38.6 41.3 37.55 30.35 -6.22 -0.56 -8.02 -5.16 6.99 -9.08 -19.17 -100.00 0.96 0.85 0.77 0.88 0.35 0.85 1.00 1.00 ?During the initial week of June(2016),there was a sudden surge in the VIJAYA BANK returns of the market. ?During the month of July(2016),there was a sudden surge in the VIJAYA BANK returns of the market. BASED ON BETA FINDINGS: ?During the month of 3 of HDFC, the beta value is -1.88 which is negative. So there was low risk compared to other months and can be expected high returns. ?During the month of 6 &7 of ANDHRA BANK the beta value is-1.00 which is negative. So there was high risk compared to other months and can be expected low returns. ?During the month of 2 of VIJAYA BANK the beta value is - 1.54 which is negative. So there was low risk compared to other months and can be expected high returns. SUGGESTIONS The following are markets which are likely to have an upward price and returns for the near future period which constitutes lesser beta values within May (2016) – December (2016). ?HDFC BANK ?ANDHRA BANK ?VIJAYA BANK • All stocks have a measure of volatility called beta. A beta of one means that the stock will react in tandem with the S&P 500. If the S&P is down 0.5%, this stock will be down the same amount. • If the beta is below one, the stock is less volatile than the overall market and a beta above one indicates that the stock will react more severely. • The best way to reduce the volatility in the trading portfolio is to sell high beta stocks and replace them with lower beta names. • Traders often adjust the volatility of their portfolio. • From the analysis the researcher suggest that investors must take decisions before investing share. HDFC & ANDHRA BANK have good price returns and less risks So that they invest both companies. CONCLUSION The analysis of testing the relationship between risk and return in the banking scripts reveals that of all the different risk variables considered in the study, the distributional risk variables, variance confirm the working of risk-return trade- off in the banking script context. Also, a positive association was exhibited between the security market return The above table and chart depicts the monthly price and returns of VIJAYA BANK and NSE NIFTY during the period of May(2016)-Dec(2016).By looking at the chart it can be observed that there exist a neutral in the returns of NSE NIFTY. During the month of July(2016),there was a sudden surge in the VIJAYA BANK returns of the market, However there is a little impact on the stock price, this may because of low correlation between VIJAYA BANK and NSE NIFTY. CHART SHOWING MONTHLY THE PRICE, RETURNS AND BETA VALUES OF VIJAYA BANK AND NIFTY: The above chart shows the changes in monthly beta values of ICICI , where in month of 2, the beta values are -1.54 which is negative. So there was low risk compared to other months and can be expected high returns. FINDINGS BASED ON PRICE AND RETURN FINDINGS: ?During the month of September there was a sudden fall in the returns of the market ?During the month of June (2016),there was a sudden surge in the returns of the market. @ IJTSRD | Unique Reference Paper ID – IJTSRD18978 | Volume – 3 | Issue – 2 | Jan-Feb 2019 Page: 1003
International Journal of Trend in Scientific Research and Development (IJTSRD) @ www.ijtsrd.com eISSN: 2456-6470 correlation and the average rate of return during the period of study. It also exposes the relation between systematic risk and rate of return on equities in India. The presence of randomness of the return series of daily, weekly and monthly market and security returns has proved that the NSE stock market is weakly efficient. It is noteworthy to express that the beta value of market exhibits a positive or negative risk-return relationship based on the fluctuations in the stock market. REFERENCES [1]Harish SNT. Mallik arjunappa Mangalore University (2000 to 2014). An Examination of the Beta Stability in the Indian Capital Market [2]Sunil M Rashinkar 1st July 2013 to 31st June 2014. A Study on Market Risk Analyses of selected Banking Stocks (Nationalized Banks) in Indian Context 2320- 2793 [3]B. Ramya November 2014.A study on stock market return and volatility analysisof nse, 2349-0187. @ IJTSRD | Unique Reference Paper ID – IJTSRD18978 | Volume – 3 | Issue – 2 | Jan-Feb 2019 Page: 1004