Download
1 / 49
490 likes | 653 Views
A STUDY OF DETERMINANTS OF PLASMA RETINOL AND BETA-CAROTENE. Tutor: Dr . Kaibo Wang Applied Statistics, Industrial Engineering, Tsinghua University Team member: Wang Jun 2009210552 Cui Wen 2009210554 Sun Ningning 2009210571 Lv Shikun 2009210566. Outline.

E N D
A STUDY OF DETERMINANTS OF PLASMA RETINOL AND BETA-CAROTENE Tutor: Dr. KaiboWang Applied Statistics, Industrial Engineering, Tsinghua University Team member: Wang Jun 2009210552 Cui Wen 2009210554 Sun Ningning 2009210571Lv Shikun2009210566
Outline • INTRODUCTION • LITERATURE REWIEW • PURPOSE OF THE STUDY • ANALYSYS RESULTS • REFERANCE
Outline • INTRODUCTION • LITERATURE REWIEW • PURPOSE OF THE STUDY • ANALYSYS RESULTS • REFERANCE
INTRODUCTION • Pastresearch: low dietary intake or low plasma concentrations of retinol, beta-carotene, or other carotenoids might be associated with increased risk of developing certain types of cancer. • Cross-sectional study: to investigate the relationship between personal characteristics and dietary factors, and plasma concentrations of retinol, beta-carotene and other carotenoids. • Experimernt: • N=315 • Patients: • Had an elective surgical procedure during a three-year period • Removed a lesion of the lung, colon, breast, skin, ovary or uterus • Non-cancerous
Outline • INTRODUCTION • LITERATURE REWIEW • PURPOSE OF THE STUDY • ANALYSYS RESULTS • REFERANCE
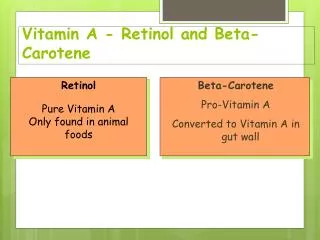
LITERATURE REWIEW 1、Observational studies have suggested that low dietary intake or low plasma concentrations of retinol, beta-carotene, or other carotenoidsmight be associated with increased risk of developing certain types of cancer ; 2、 The relationship between plasma carotenoids, plasma cholesterol, cigarette smoking, vitamin supplement use, and intakes of alcohol, vitamin A, and carotene were investigated in 1981 by in the research of Russell-Briefel R ; 3、The relationship of diet and nutritional supplements, cigarette use, alcohol consumption, and blood lipids to plasma levels of beta-carotene was studied among 330 men and women aged 18–79 years in the research of Stryker WS.
LITERATURE REWIEW 1、Many epidemiologic studies have been conducted primarily as dietary studies of vitamin A and carotene, or as blood studies of serum retinol. 2、 Willett WC showed that, with higher levels of retinol plasma, the risks of get cancer may be decreased. However, plasma retinol levels are under strict control and a high intake of preformed vitamin does not seem to be relevant for cancer prevention; 3、Stähelin, H. B. suggested an inverse relationship between vitamin A and cancer risk, although some studies have found no relationship. Then people find that a lower retinol levels is not the cause of an invasive cancer. Instead, it is the cancer that brings about a lower retinol level in human body;
Outline • INTRODUCTION • LITERATURE REWIEW • PURPOSE OF THE STUDY • ANALYSYS RESULTS • REFERANCE
PURPOSE OF THE STUDY • Tofind out internal factors which may have some effect or relationship with the beta-carotene and retinol in people’s plasma. • Age (years) • Quetelet: • Number of calories consumed per day. • Grams of fat consumed per day. • Grams of fiber consumed per day. • Number of alcoholic drinks consumed per week. • Cholesterol consumed (mg per day). • Dietary beta-carotene consumed (mcg per day). • Dietary retinol consumed (mcg per day) • Sex (1=Male, 2=Female). • Smoking status (1=Never, 2=Former, 3=Current Smoker) • Vitamin Use (1=Yes, fairly often, 2=Yes, not often, 3=No)
Outline • INTRODUCTION • LITERATURE REWIEW • PURPOSE OF THE STUDY • ANALYSYS RESULTS • REFERANCE
ANALYSYS RESULTS Content: • Variables Types and Levels Quantitative variables & Categorical variables • Descriptive Analysis For all 12 independent variables, with: Summary Statistics/Histogram/Scatter Plot • Data Analysis via Regression & General Linear Model 3.1 BETA-CAROTENE 3.2 RETINOL
2.Descriptive Analysis Variable: SEX 1:Male 2:Female Plasma Retinol: Male is higher than female Beta-Carotene: Female is a little higher and more outliers
2.Descriptive Analysis Variable: VITUSE(Vitamin use) 1=Yes, fairly often, 2=Yes, not often, 3=No Plasma Retinol: No much difference, almost in the same level Beta-Carotene: Often users>Not-often users>Non-users
2.Descriptive Analysis Variable: SMOKSTAT(Smoking Status) 1=Never, 2=Former, 3=Current Smoker Plasma Retinol: Former smokers has the highest level Beta-Carotene: Never smokers contains higher level
2.Descriptive Analysis An example for continuous variables
2.Descriptive Analysis Variable : AGE, QUETELET , CALORIES AGE(age): Most in the area between 32 and 77who are basically middle-age or elderly people. QUETELET( ): Most between 18.5 and 30 who are normal and some are a little overweight. CALORIES(calories): Most are concentrated between 1000 and 2200.
2.Descriptive Analysis Variable: QUETELET( ) Standard category from WHO: Quetelet is a statistical measurement which compares a person's weight and height.
2.Descriptive Analysis Variable: FAT, FIBER, ALCOHOL FAT: Grams of fat consumed per day. Most are between 45 and 135. FIBER: Grams of fiber consumed per day. Between 6 and 18 ALCOHOL: Number of alcoholic drinks consumed per week. Most rarely drink, but there is an obvious outlier, which reaches 203 alcohol per week.
2.Descriptive Analysis Variable: CHOLESTEROL, BETADIET, RETDIET CHOLESTEROL:milligram of cholesterol consumed per day BETADIET : microgram of dietary beta-carotene consumed per day RETDIET : microgram of dietary retinol consumed per day Most are between 500 and 1500.
3.1 data analysis about BETA-CAROTENE AGE QUETELET CALORIES FAT FIBER ALCOHOL CHOLESTEROL BETADIET RETDIET SEX SMOKSTAT VITUSE Beta-carotene content in plasma ? 1、Regression 2、GLM
3.1.1 data analysis via Regression(BETA-CAROTENE) Steps of Regression: 1、Check data distribution through scatter plots 2、Best subset and stepwise regression to select predictors 3、Do regression and residual check 4、Do transformation 5、The final model
3.1.1 data analysis via Regression(BETA-CAROTENE) 1、Check data distribution through scatter plots transformation can not avoid data aggregations, and therefore delete the outliers
3.1.1 data analysis via Regression(BETA-CAROTENE) 2、Use best subset and stepwise regression to select predictors • Use dummy variables to take place of discreet variables: SEX, SMOKSTAT and VITUSE • Result of stepwise regression :
3.1.1 data analysis via Regression(BETA-CAROTENE) 3、 Do regression and residual check
3.1.1 data analysis via Regression(BETA-CAROTENE) 4、Do transformation • use log (plasma beta-carotene) to replace plasma beta-carotene • Redo step1—step3
3.1.1 data analysis via Regression(BETA-CAROTENE) • 5、The final model Log (plasma beta-carotene) = 2.32 - 0.0140QUETLET -0.124vitamin_status_3- 0.116 smoking_status_3 + 0.000025 BETADIET - 0.00113 FAT+ 0.00248 AGE+ 0.0934 sex_2 + 0.00632 FIBER
3.1.2 data analysis via GLM(BETA-CAROTENE) Steps of GLM: 1、Check data distribution through scatter plots 2、Select predictors by trial 3、GLM model 4、Residual check
3.1.2 data analysis via GLM(BETA-CAROTENE) 1、Check data distribution through scatter plots similar to step 1 of regression 2、Select predictors by trial
3.1.2 data analysis via GLM(BETA-CAROTENE) 3、GLM model Log (plasma beta-carotene) =2.3061+0.002224 AGE-0.014010QUETLET+0.00818FIBER+0.000021BETADIET+0.000034BETADIET*Vitamin_1
3.1.2 data analysis via GLM(BETA-CAROTENE) 4、Residual check
3.1 data analysis about BETA-CAROTENE Log (plasma beta-carotene) = 2.32 - 0.0140QUETLET -0.124vitamin_status_3- 0.116 smoking_status_3 + 0.000025 BETADIET - 0.00113 FAT+ 0.00248 AGE+ 0.0934 sex_2 + 0.00632 FIBER Conclusion : 1、 The coefficient of QUETLET, vitamin_status_3, smoking_status_3 and FAT are negative, which indicates that with the increase of these variables, there would be a decrease of the content of beta-carotene in plasma; 2、 The coefficient of BETADIET, AGE, Sex_2 and FIBER are positive, which indicates that with the increase of average number of these variables, there would also be an increase of the content of beta-carotene in plasma.
3.2.1 data analysis via Regression( RETINOL ) Steps of Regression: 1、Check data distribution through scatter plots 2、Best subset and stepwise regression (3 methods) to select predictors 3、Do regression and residual check 4、Draw conclusion
3.2.1 data analysis via Regression( RETINOL ) 1、Check data distribution through scatter plots
3.2.1 data analysis via Regression( RETINOL ) 1、Check data distribution through scatter plots
3.2.1 data analysis via Regression( RETINOL ) 2、Use best subset and stepwise regression to select predictors • Using dummy variables to transform the Categorical variables • Define SEX_F=SEX-1,so SEX_F=1, when SEX=Female; SEX_F=0, when SEX=Male.
3.2.1 data analysis via Regression( RETINOL ) 2、Use best subset and stepwise regression to select predictors • Select 7 variables : AGE, QUETELET, ALCOHOL, BETADIET, SEX_F, SMOK_2, and VITUSE_1 • Result of stepwise regression :
3.2.1 data analysis via Regression( RETINOL ) 2、Use best subset and stepwise regression to select predictors • The model is :
3.2.2 data analysis via GLM(RETINAL) Steps of GLM: 1、Select interaction predictors by trial 2、GLM model 3、Residual check
3.2.2 data analysis via GLM(RETINAL) 1、Select predictors by trial Finally find no interaction predictor.
3.2.2 data analysis via GLM(RETINAL) 3、GLM model
3.2.2 data analysis via GLM(RETINAL) 4、Residual check
3.2.2 data analysis via GLM(RETINAL) Regression: Conclusion : • The coefficient of AGE is positive in both models, indicating that as people get older, the plasma retinal level will raise. • Both model shows that people drink more wine will have higher plasma retinal level. But the data of ALCOHOL is almost all less than 10, so its influence is not obivous. GLM:
3.2.2 data analysis via GLM(RETINAL) Regression: GLM: Conclusion : • 3. The coefficient of BETADIET is negative in both models, which means that people consuming more beta-carotene have lower level of plasma retinal. So balance of different vitamin is very important. • The coefficient of 3 dummy variables in regression model is -71.7, 41.9 and -43.4, indicating women’s average plasma retinal level is lower than men’s. People who are former smokers or never use vitamin have lower plasma retinal level .
Discussion We conclude that there is wide variability in plasma concentrations of these micronutrients in humans, and that much of this variability is associated with dietary habits and personal characteristics. A better understanding of the physiological relationship between some personal characteristics and plasma concentrations of these micronutrients will require further study.
Outline • INTRODUCTION • LITERATURE REWIEW • PURPOSE OF THE STUDY • ANALYSYS RESULTS • REFERANCE
REFERANCE • Peto R, Doll R, Buckley JD, et al. Can dietary beta-carotene materially reduce human cancer rates? Nature 1981;290:201-8. • Russell-Briefel R, Bates MW, Kuller LH. The relationship of plasma carotenoids to health andbiochemical factors in middle-aged men. Am J Epidemiol 1986;122:741-9. • Stryker WS, Kaplan LA, Stein EA, et al. The relation of diet, cigarette smoking, and alcohol consumption to plasma beta-carotene and alphatocopherol levels. Am J Epidemiol 1988;127:283- 96. • Adams-Campbell, L. L., M. U. Nwankwo, et al. (1992). Serum retinol, carotenoids, vitamin E, and cholesterol in Nigerian women. Nutritional Biochemistry 3(2): 58-61.
REFERANCE • Comstock, G. W., M. S. Menkes, et al. (1988). Serum levels of retinol, beta-carotene, and alpha-tocopherol in older adults.American Journal of Epidemiology 127(1): 114-123. • Russellbriefel, R., M. W. Bates, et al. (1985). The relationship of plasma carotenoids to health and biohchemical factors in middle-aged men. American Journal of Epidemiology 122(5): 741-749. • Stähelin, H. B., E. Buess, et al. (1982). vitamin A, cardiovascular risk factors, and mortality. The Lancet 319(8268): 394-395. • Van Poppel, G. and H. van den Berg (1997). Vitamins and cancer. Cancer Letters 114(1-2): 195-202.
Thank You For For Attention