Download
1 / 37
370 likes | 466 Views
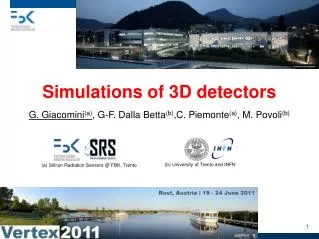
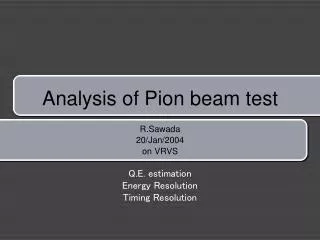
2009 SPS Pion beam tests of 3D TimePix Detectors. C. Parkes on behalf of Glasgow & CNM. Pion testbeam was conducted by LHCb/Medipix groups, led by Richard Plackett. See backup slide for full list of participants. Outline. Introduction 3D double sided detectors substrates Timepix description

E N D
2009 SPS Pion beam tests of 3D TimePix Detectors C. Parkes on behalf of Glasgow & CNM Pion testbeam was conducted by LHCb/Medipix groups, led by Richard Plackett. See backup slide for full list of participants
Outline • Introduction • 3D double sided detectors substrates • Timepix description • Pion-beam from SPS • Telescope • Pulse height spectra • Detection Efficiency • Cluster size • Resolution • Conclusions
Detector substrates - 3D and Planar • Detectors designed by Glasgow/CNM and fabricated at Centro Nacional de Microelectronica, Barcelona • Columns are etched from opposite sides of substrate • Column fabrication: • Reactive ion etching • Partial filing with polysilicon then doping • TEOS almost fills hole • Substrate is 285µm thick • Columns are 250µm deep and dead inside the column • Low field region around top of ohmic columns • n-type bulk, p-type junction columns connected to electronics • Hole collection • Square array of ohmic columns with junction column at centre, array pitch of 55µm
Timepix • 256 x 256 pixel array • 65k single-photon counting pixel array • Square pixel size of 55µm • Electron or hole collection • Global and pixel threshold equalisation • 1 counter per pixel with 14bit depth • Time over threshold to measure signal size • 100ns rise time • Count rate of ~100kHz • Shutter control – no pipe line • Readout in 300µs • High dynamic range • 3D Timepix bump bonded at VTT
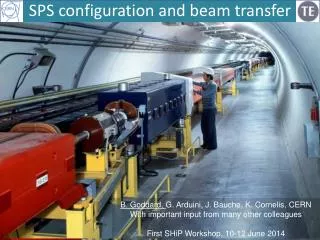
MIP beam from SPS Medipix & LHCb • Secondary 120 GeV pion beam from SPS • No B-field, non-irradiated sensors • USB Interface for Timepix (CTU, Prague) • 4 Timepix, 2 Medipix planes in telescope • Angled at 9degs to vertical and horizontal axes to get best resolution • DUT: double sided 3D N-type sensor from CNM/Glasgow • Expected track extrapolation error: < 2 μm • DUT can be rotated to give different angles of incidence. Pion beam Individual pion tracks telescope DUT
MIP beam from SPS Medipix & LHCb • Secondary 120 GeV pion beam from SPS • No B-field, non-irradiated sensors • USB Interface for Timepix (CTU, Prague) • 4 Timepix, 2 Medipix planes in telescope • Angled at 9degs to vertical and horizontal axes to get best resolution • DUT: double sided 3D N-type sensor from CNM/Glasgow • Expected track extrapolation error: < 2 μm • DUT can be rotated to give different angles of incidence. Pion beam Individual pion tracks telescope DUT
Testbeam analysis • Shutter driven DAQ • No scintillator trigger • No pipeline or event number • Data collection method • Open shutter • Collect 100-1000 events - occupancy at 0.2% level or less • Close shutter - 10ms later • Read out data • Event rate of 200Hz • Reconstruct tracks • Set threshold on telescope planes to 1600 electrons to reduce noise events • Assume that no two hits are in neighbouring pixels • Cluster all neighbouring pixel hits • Cluster is excluded is exceeds a 3x3 limit • Cluster is excluded is there is another hit in a 9x9 region around cluster • Centre of cluster is found (C.of.G or Eta) • Clusters in all planes are fitted with a straight line tack fit • When a cluster is associated with a track it is removed from the data set to prevent re-use. • All planes must be used in a track for the track to be valid • Typically 64 trackers per 100 clusters per plane (only 85% included due to alignment errors) • Minimisation procedure followed to minimise residuals via software alignment of detector planes • Pointing resolution of the telescope at the position of the DUT of 2µm • DUT - similar process as with telescope planes
Rotational Alignment of DUT • X-y-z alignment performed via minimization of residuals between cluster and track • Angular alignment performed by measuring samples over a wide range of angles and looking for minimums in row width, column width and fraction of 1pixel events
Energy Spectra – TOT Mode Clusters made and then track associated with them Can look at pulse height from single pixel at the centre of the cluster or from cluster Plot “mean” of pulse height as function of track position in a pixel Threshold just above noise level at 1000 electrons ADC in pixel ADC in sum of 3x3 pixel 2D Normalised average ADC plot, 20V bias Normalisation : assume average signal size =100 for a ring around the central column
Energy Spectra at varying Bias Voltages Pulse height spectra for region at centre of pixel 8V 20V 2V Depleted Region Depleted Region Depleted Region Partially Depleted Region Depleted Region
Landau MPV as a function of Bias Voltage • MPV of deconvolved Landau from fit of Landau convoluted with a Gaussian to the high energy peak in the pulse height spectra from the full charge collection region around the collection column. Only 5% increase in MPV
7 ADCshared 7 ADC 30 ADC Energy Spectra – ToT mode, Normal incidence, 0o Overall, from single pixel not cluster Single Pixel 3x3 Pixels Signal ratios suggests shorter columns, 220 not 250µm deep?
Energy Spectra – ToT mode, 10o Overall, for single pixel not cluster Single Pixel 3x3 Pixels Centre
Cluster and single pixel P.H.S. Single pixel P.H.S Cluster P.H.S • 0o incidence • 10o incidence
Absolute Detection Efficiency Normal Incidence, 0° Cluster in DUT included if in 3x3 pixel array around the track intersection point Bad pixels are masked : 0.1% noise/dead + 1% due to ASIC 92.14% Threshold set just above noise level.
Absolute Efficiency 10° 98.87%
Absolute Efficiency 18° 98.52%
Efficiency – search window • Increasing the search window increases the efficiency Efficiency at 10o incidence
Efficiency with angle • Highest efficiency of 99.8% • Efficiencies over device become equal
Cluster size • The S/N cut is the one from the hardware, 1000e. • If there is a hit (above hardware Vth) then it is included in the hit histogram. • Clusters used that are track associated ones
Resolution • Pitch/ sqrt 12 = 15.9µm • Resolution improves with angle to 10deg where track travels 50µm laterally • Lots of 2 hit clusters with non-equal pulse heights improves resolution • At 18deg lateral travel is 90µm, and 2 hit clusters have equal pulse heights
Residuals for different cluster sizes 10o 18o 0o 2o 4o • Red is residuals for 2 hit clusters
Resolution as a function of cluster size Resolution (µm) Angle
A study of charge sharing Number of clusters and their positions in the pixel 3D Planar >1 pixel clusters Total of clusters 1 pixel clusters 2 pixel clusters 3 pixel clusters 4 pixel clusters
Charge sharing – 3D 0o 10o 18o 1 pixel clusters 2 pixel clusters 3 pixel clusters 4 pixel clusters Detector rotated in the vertical direction
Charge sharing - planar 0o 5o 10o 18o 1 pixel clusters 2 pixel clusters 3 pixel clusters 4 pixel clusters Detector rotated in the horizontal direction
Conclusions • 3D Timepix detector successfully operated in MIP test beam. • Charge collection observed from both inter-column and column-back plane regions. • Charge loss at electrodes observed. • Reduced average charge collected at 10o track angle due to dead columns • High (99.8%) and uniform detection efficiency observed at 10o track angle • Little diffusion charge sharing observed • Resolution of pitch/square root 12 for normal incidence • Resolution best at 10o = 9.2µm
Full list of authors • University of Glasgow, Department of Physics and Astronomy, Glasgow, UK: • R. Bates, A. Mac Raighne, C. Parkes, G. Stewart, R. Plackettd, E. Rodrigues, A. Mac Raighnea, M. Nicola, L. Eklund, L. F. Llina, D. Maneuskia, • Instituto de Microelectronica de Barcelona, IMB-CNM-CSIC, Barcelona, Spain: • G. Pellegrini, C. Fleta, M. Lozano, M.Ullan • Other insitutes • M. Artusoj, F. Bayer, J. Buytaerte, P. Collinsd, M. Crossleye, A. Gallase, M. Gandelmani, M. Gersabeckd , V. Gligorovd, T. Husef, M. Johng, T. Michelk, D. E. Perirae, P. Vazqueze. d) CERN CH-1211, Genève 23, Switzerland. e) Facultad de Fisica , University of Santiago de Compostela, Santiago de Compostela, Spain. f) Department of Physics, The University of Liverpool, Liverpool, United Kingdom. g) Department of Physics, University of Oxford, UK. h) Nikhef, Science Park 105, 1098 XG Amsterdam, The Netherlands. i) Instituto de Fisica, Univ. Federal do Rio de Janeiro, Brazil. j) Syracuse University, Syracuse, NY 13244, U.S.A. k) Erlangen Centre for Astroparticle Physics, Universität Erlangen-Nürnberg, Erwin-Rommel-Str. 1, 91058 Erlangen, Germany
Energy Spectra – ToT mode 7 ADCshared 7 ADC 30 ADC 1-12 show ADC counts at positions along cross section from centre to the corners 4 1 2 3 5 6 7 8 12 11 10 9 Peaks seen at ~7 and ~30 ADC counts
Energy Spectra at varying Angles • Position of primary peak in landau distributions. This can be explained in part as the mip now travels through a hole which is non-sensitive For a 10o track the mip goes through 1.5% more thickness. Now the mip is more likely to go through the hole. This is 10µm in diameter. Assume that it goes through 10µm then it has a path length of 57µm. So we loose 57/289 = 0.2 (20%) which brings the ADC down from 30 to 24.