Download
1 / 17
170 likes | 333 Views
Swift/BAT Hard X-ray Survey. 35'. Preliminary results in Markwardt et al 2005. energy coded color. BAT Instrument Parameters. Energy Range 14 - 195 keV Area 5200 cm 2 (x 50% open fraction) Field of View 2 Steradian, partially coded Background 10,000 ct/s (cosmic diffuse dominated)

E N D
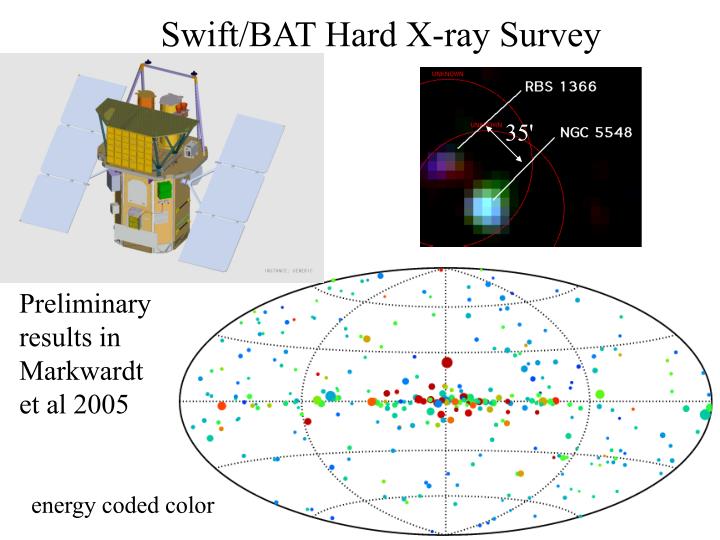
Swift/BAT Hard X-ray Survey 35' Preliminary results in Markwardt et al 2005 energy coded color
BAT Instrument Parameters • Energy Range 14 - 195 keV • Area 5200 cm2 (x 50% open fraction) • Field of View 2 Steradian, partially coded • Background 10,000 ct/s (cosmic diffuse dominated) • Spatial 21’ sky pixel, centroided to <1-3’Resolution • Spectral 6 keV FWHM @ 60 keV, average Resolution • Sensitivity 0.2 photons/cm2/sec • Timing Resolution 100 usec • Observing “Random” (piggy-back SwiftStrategy GRB observing plan)
9-month Swift/BAT Survey > 1.5 Ms 1-1.5 Ms 0.5-1 Ms Ecliptic Plane 8.5 mCrab (T/20 ks)-0.5 Sensitivity vs Time • Exposure Map • Covers whole sky, mostly >1Ms • deficit on Ecliptic Plane due to Sun avoidance • Sensitivity improves as square root of time (1.2-2 X statistical) to 0.6 milliCrab in 3 years
|Galactic b| >15 (74%) • ---------------------- • 159 sources • 9 unidentified sources • 29 galactic • 2 galaxy clusters • 121 AGN • 15 beamed • 9 months • --------------------- • 323 sources • 39 unidentified sources • 158 galactic • 5 galaxy clusters • 158 AGN • 16 beamed BAT Source Detections already the most sensitive all-sky hard x-ray survey At 3 years expect 450 AGN.
BAT GALAXY Identifications absorbed Log nH > 22 |Gal b| >15 • 70% of the galaxies with no Sy classification are absorbed. • Most unknown galaxies are absorbed Sy2's or edge on spiral galaxies with no lines (3 with no spectroscopy) • Sy2/Sy1 ratio is 1.2 (0.5 Sy1.5/Sy1) and 52% of Seyfert galaxies are absorbed confirming Markwardt et al 2005 Much lower than 75% predicted by the standard model for the CXB
Correlations of BAT Rate with other Bands • no correlation between BAT and ROSAT count rates • 44 BAT sources not detected by ROSAT • no close correlation with total 2MASS J band • soft x-ray and IR do not measure true AGN luminosity or complete populations
Heavily Absorbed and Complex Spectra Abound BAT XMM peaks at 20 keV • >25% of BAT sources have weak soft X-ray emission • only a survey at >20 keV is unbiased by absorption • Many have extremely complex spectra with soft and hard components that seem unrelated • Simultaneous X-ray and hard X-ray spectra are required to understand AGN
LogN/LogS and Luminosity Function • errors 25% in normalization, ~10% in slopes and <1% in break luminosity • New, much tighter constraints will test CXB models • Treister, Urry, and Lira: standard unified AGN model 2500 AGN, LBAT>10-11ergs cm-2 s-1 • BAT measures 1100 AGN, LBAT>10-11ergs cm-2 s-1 • Pashak Ghandi800 AGN, LBAT>10-11ergs cm-2 s-1
Average BAT AGN Spectrum • no evidence for a break below 200 keV • same with brightest 36 AGN removed • Same for luminosity <1044 or >1044 • Contrast with strong break at 40 keV in CXB • spectrum is much flatter than CXB (slope = 2.75) above the break Crab Normalized Response
Background vs BAT AGN Spectrum E-2 150 keV BAT UL • BAT AGN spectrum is a bad fit to CXB for E>40 keV • Soft x-ray surveys put source of CXB at Z=0.7 • to fit the CXB the BAT AGN must be at Z > 1 or show strong spectral evolution
What is the Blazar Contribution to the CXB? Beamed Fraction Beamed Sources • BAT beamed sum spectrum is 10-16% AGN sum • In 3 years, BAT will detect >40 beamed sources. • BAT survey can answer this question.
Conclusions • The first complete AGN survey is answering many of the old questions about AGN and their contribution to the CXB. • What are the numbers of hard x-ray AGN? • 1100 AGN,LBAT>10-11ergs cm-2 s-1 14-200 keV • Are the hard x-ray AGN and CXB spectra the same? No • Does the standard unified model explain all? No • How many of the AGN are absorbed? ~0.6 not 3/4 • What is the blazar contribution to CXB? 10-15% • Follow up of the BAT selected AGN offers many exciting new opportunities.We are just getting started!
BAT Survey Characteristics 8.5 mCrab (T/20 ks)-0.5 UVOT XRT BAT XRT joint spectra BAT • survey sensitivity is still improving as the square root of time • a longer survey detects more sources but it also makes better spectra for the previous sources • 4 energy bands will be expanded to 8 bands soon • extragalactic BAT sources are easily to identify at high latitudes • very bright IR galaxy • low redshift (z<0.06) • optical AGN or high absorption • XRT positions and joint XRT/BAT spectra make ID's unambiguous Sensitivity vs. Exposure
Tests of the Standard Model With <E>~50 kev BAT measures the true nature of the continuum relatively unaffected by absorption or scattering • BAT selected Sy1's have softer spectra than Sy2's (5.7) • BAT selected Sy1's have higher luminosity than Sy2's (3.6) • differences are small, so no selection effect for BAT
Absorption's Effect on Luminosity Function • more high luminosity with NH<22 and more low luminosity NH>22 • more statistics required • the Swift/BAT survey will get there
Swift/BAT and Integral luminosity functions • the INTEGRAL and Swift/BAT luminosity functions are in rough agreement • The Sazanov data seems to be systematically higher