Download
1 / 17
170 likes | 288 Views
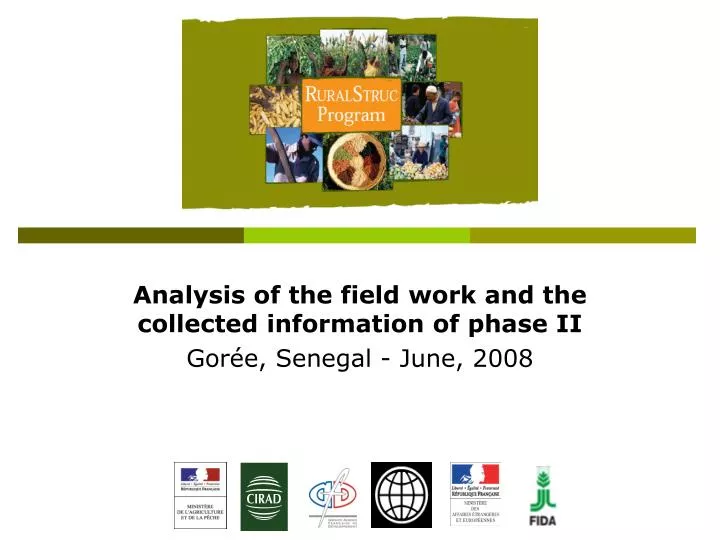
Analysis of the field work and the collected information of phase II Gorée, Senegal - June, 2008. Goal of the data analysis. The surveys are only significant and representative at the local level However, they can be illustrative of the regional dynamics and trends…

E N D
Analysis of the field work and the collected information of phase II Gorée, Senegal - June, 2008
Goal of the data analysis • The surveys are only significant and representative at the local level • However, they can be illustrative of the regional dynamics and trends… • The surveys combined with the regional studies and chain analyses provide: • a general description of local characteristics • a justification of the choice of the selected regions • Information to respond to the program hypotheses
Main characteristicsof the selected regions Descriptive analysisof the sample
Country Region 1 Region 2 Region 3 Main characteristics of the regional sample LEVEL 1 Analysisof the heterogeneity(local level) LEVEL 2 Global income analysis per quintile LEVEL 3 Farm incomeanalysis LEVEL 4
Level 1: regional data breakdown* • Main characteristic of the regional sample • Demography • Size of the household in adult equivalent • Dependency ratio • Human capital • Education • Social capital • Network index • Structure of economic activities • % of HH • Global income • Level, distribution and structure of income => which allows to test the differences between regions • Mean: income shares are calculated for each household, and then the mean of the household shares of each type of income is calculated * At the household level per region:mean, median, min/max, standard deviation
Level 2: explanation of the heterogeneity or homogeneity of the regional results • If the analysis of the global income at the regional level gives a high standard deviation => check of the heterogeneity at the local level (locality, community, village) * mean, median, min/max, standard deviation
Level 3: Global income classes analysis 1 20% of HH 20% of HH 20% of HH 20% of HH 20% of HH 2 20% of income 20% of income 20% of income 20% of income 20% of income • In order to compare the income structure and their characteristics among the 7 RS countries, we must split our sample into 5 equal rural households’ quintiles from the poorest to the richest • This way of calculating the quintiles [or deciles] is different from income distribution analysis (level 1) 1 2
Level 3: Global income classes analysis Farm income Agricultural wages Self-employment Non agricultural wages Transfers Rents • Importance of a given income source in the global income at the household level • Mono-variable analysis on the main characteristics per income quintile (mean, median, min/max, deviation) => Demography, human and social capital
Level 4: Farm income classes analysis • Mono-variable analysis • > factor endowment : land, workforce, capital and equipment =>Demography, human and social capital
Test of cross-tab analysis on explanatory variables (example)
Example: Durable goods index • Number of HHs: n = 300 • Probability of having a refrigerator: • If HH 1 has a refrigerator, than: • Durable goods index: • To allow cross-country comparison, the number of durable goods has to be the same in each country
Response to the main hypothesis of RS Existing processesof differentiationamong rural households
H1: segmentation on the basis of market access and integration process • Identification of the integrated chains or variations among chains? • Criteria of integration? • Contracts? • Structure of the value-chain? • Marketing channel? • Characteristics of the HH integrated/ participating in integrated value-chain? • Implications of integration on farm income?
H1: segmentation and integration(result of Thursday’s pm discussion) • 1. types of chains with integration characteristics of product / specific assets / market (product or demand driven) • 2. type of marketing (HH level) • Spot market • Middlemen • Monopsony • S.Markets • 3. formal / informal contracts • 4. characteristics of contracts based on: • Product characteristics • Inputs / services provision • 5. Index of integration (% of farm income with integrated chains) • 6. Characteristics of the integrated HH • 7. Implications of integration on farm income?
H3: Segmentation on the basis of diversification of activities & income • What definition of diversification? • Farm / off-farm - Index of diversification? • State of diversification in the selected regions • Importance of agricultural income • Development of waged labor (agri/non-agri) • Other activities and transfers • Characterization of the HH diversifying their activities and income sources • Implication of diversification on global income