Download
1 / 18
• 180 likes • 300 Views
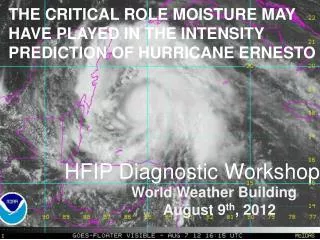
Model Diagnostics: HRD Activities and Plans. HFIP Diagnostics Workshop Friday, August 10, 2012. Joe Cione, Rob Rogers, Eric Uhlhorn, Tomi Vukicevic, and Jun Zhang. Outline. HWRF surface-layer evaluations (Cione, Uhlhorn)

E N D
Model Diagnostics: HRD Activities and Plans HFIP Diagnostics Workshop Friday, August 10, 2012 Joe Cione, Rob Rogers, Eric Uhlhorn, Tomi Vukicevic, and Jun Zhang
Outline • HWRF surface-layer evaluations (Cione, Uhlhorn) • Preliminary HWRF vortex- and convective-scale evaluations during RI (Rogers) • Preliminary HWRF PBL evaluations (J. Zhang) • New low-wavenumber verification metric (Vukicevic)
What is the dominant thermodynamic factor impacting TC surface moisture flux? Ocean (qs(SST))…or…Atmosphere (q10) TCBD (observations) HWRF V3.2
How well does HWRF represent low-order structure of an intensifying TC? • Composites of inner-core structure from airborne Doppler for intensifying and steady-state TC’s indicate distinct differences in inner-core structure • How well do HWRF forecasts of intensifying and steady-state TC’s depict this structure? Can it capture these differences? • First step: start with a single HWRF forecast of an intensifying TC (Earl 2010) 3-km HWRF (initialized 12 UTC 27 August) forecast track and intensity
Intensity traces Steady-state (SS) Intensifying (I) HWRF Earl forecast
Axisymmetric vertical vorticity (x 10-4 s-1) 14 14 13 13 12 12 33 11 11 30 10 10 27 9 9 24 height (km) height (km) 8 8 21 7 7 18 6 6 12 5 5 9 4 4 6 3 3 5 2 2 4 1 1 3 0 0 0.5 1 1.5 2 2.5 3 0.5 1 1.5 2 2.5 3 r/RMW r/RMW 14 I SS 13 33 12 30 11 10 27 24 9 height (km) 8 21 7 18 6 12 5 9 4 6 3 5 2 4 1 3 0 0.5 1 1.5 2 2.5 3 r/RMW HWRF
# of burst grid points (> 5.5 m/s) = 342 # of burst grid points (> 5.5 m/s) = 749 Locations of convective bursts # of burst grid points (> 3 m/s) = 300 I SS HWRF
HWRF frequency (%) r/RMW I SS frequency (%) frequency (%) r/RMW r/RMW Radial distribution of convective bursts
HFIP proposal PI: Jun Zhang, David Nolan and Sylvie lorsolo Collaborators: Robert Rogers and Paul Reasor Objectives: To develop metrics for evaluating the inner-core structure simulated by the HWRF model in order to improve the intensity and track forecast. 1) vortex-scale structure 2) convective-scale structure 3) boundary layer structure Year 1: 1) develop metrics for model evaluation through analyzing observational data (i.e., Doppler radar and dropsonde data) 2). Test the structural metrics using case study
Height of Vtmax model Black dashed line represents the height of maximum tangential wind speed
Inflow layer depth model Black line represents the height of 10% peak inflow
Mixed layer depth model Black line represents dθv/dz=3K/km
Future work Test other metrics using the Earl run: 1.eyewall slope 2. TKE 3. CFADs of vertical velocity 4. Metrics for asymmetric structure ……
A new metric for intensity forecast verification Tomi Vukicevic, Erick Uhlhorn, Paul Reasor and Brad Klotz NOAA/AOML/HRD
Maximum intensity decomposition • Without approximation, the maximum intensity of a wind field at 10 m (or any height) in coordinate system could be expressed by the following decomposition • and are amplitudes of azimuthal wave number 0 and 1, respectively • is total contribution from higher harmonics • Maximum intensity = deterministic + stochastic component • By definition because
Maximum intensity verification using the decomposition • is characterized by a non-Gaussian pdf • Verification of the maximum intensity consists of • Verification of PDF and • Deterministic amplitude • Data used for verification • Observations: BT, SFMR (P-3/NOAA and AF), TDR (P-3) Model : HWRFx forecasts and HEDAS analyses • Cases from 2008-2011 seasons
Verification of stochastic component : comparison of PDFs HEDAS V0, V1 and Vmax HEDAS V0 and V1 USING BT Vmax FORECAST V0, V1 and Vmax OBSERVATIONS ONLY SFMR V0+V1 and BT Vmax All PDFs show stochastic nature of with small mean, standard deviation compatible with the BT error estimate (~4-5 m/s), and positive skewness Forecast- and observation-based PDFs are compatible implying that the forecast has good skill for the stochastic component of the intensity OBSERVATIONS ONLY TDR V0 and V1 and BT Vmax
Verification of deterministic component Examples of Wave 0 RI, while stochastic component is negative • So far have forecast decomposition results • Working on verification against SFMR based decomposition • Need to match SFMR and Forecast dates for verification of wave 0 and 1 amplitudes