Download
1 / 26
260 likes | 384 Views
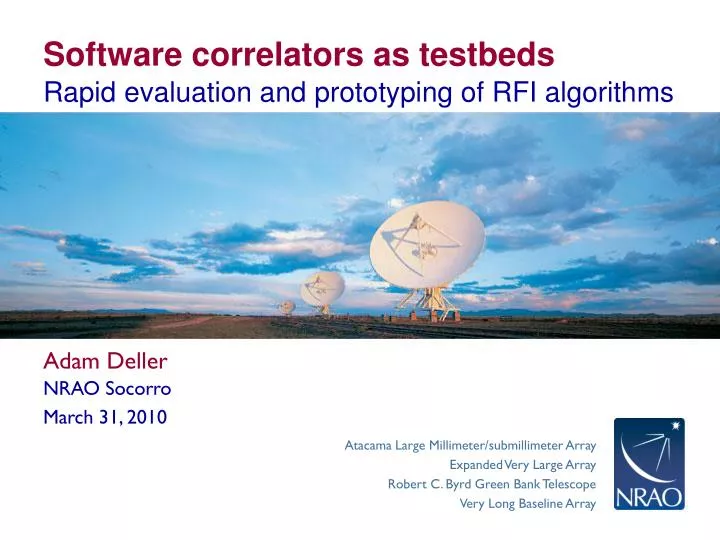
Software correlators as testbeds. Rapid evaluation and prototyping of RFI algorithms. Adam Deller. NRAO Socorro March 31, 2010. Why use in-correlator techniques for RFI detection and mitigation? Software correlators: Key attributes and advantages Applications in RFI algorithm development

E N D
Software correlators as testbeds Rapid evaluation and prototyping of RFI algorithms • Adam Deller • NRAO Socorro • March 31, 2010
Why use in-correlator techniques for RFI detection and mitigation? Software correlators: Key attributes and advantages Applications in RFI algorithm development Test case: Kurtosis-based detection of RFI Conclusions Outline 2
Higher time resolution data Easier to identify impulsive/short time duration RFI Removal of affected areas can potentially lead to less data loss Other techniques such as Field of View (FOV) shaping require modifying data on timescales shorter than 1 integration Why in-correlator techniques? 3
EVLA example Frequency Time Aircraft radar(12s period) 4
Software correlators • Correlation algorithm is coded in a high-level language such as C++, runs on commodity machines (nowadays, multicore rackmount servers) • Rapid and inexpensive to develop • Widely used in VLBI (DiFX correlator used by LBA, VLBA, MPIfR Bonn, …) • Key point here: quick/easy to modify 5
Software correlators The hardware used for the VLBA DiFX software correlator in Socorro; 5 x dual motherboard, dual CPU quad cores (process 10 stations x 128 MHz b/w in real time) 6
Baseband data DataStream 1 Core 1 DataStream 2 Core 2 … … processing buffer processing buffer DataStream N Core M processing buffer Visibilities Timerange, destination Source data Master Node Visibility buffer Visibility buffer Visibility buffer The DiFX architecture (~100ms) All processingdone infloats Large, segmented ring buffer Up to 100s MB/ a few or more seconds Interconnect is commodity ethernet (Message Passing Interface). Optimised C vector libraries used for speed-up. 7
The DiFX architecture • FX style correlator • Requires only a couple of libraries and a C++ compiler - easy to get going • DiFX reads baseband data from a file or network stream (Mk4, VLBA, LBA, VDIF*) • Output: Produces FITS-IDI files (easy path to AIPS/CASA) * Aside: VDIF is a simple but general packet-based format, hopefully convergence here - for specs see www.vlbi.org/vsi/docs/VDIF specification Release 1.0 ratified.pdf 8
DiFX info • Google group: http://groups.google.com/group/difx-users?hl=en • Wiki: http://cira.ivec.org/dokuwiki/doku.php/difx/start • SVN codebase: https://svn.atnf.csiro.au/trac/difx/ 9
Kurtosis analysis • Basically measures the peakedness of pdf of a time varying quantity - equal to 3 for normally distributed quantities • Impulsive RFI leads to a pdf with many outliers and a kurtosis value >> 3 • Subtle differences between real time domain data and complex frequency domain data (Nita, earlier) 10
Kurtosis analysis • I applied kurtosis analysis to channelized (post-FFT) data from each antenna (not cross-correlations) • Easy to calculate - just need 2nd (autocorrelation) and 4th (autocorrelation^2) central moments of the quantity of interest • Easiest to maintain moments about the origin 1 - 4, convert at desired duty cycle De Roo (2009), IEEE Trans. Geosc. Rem. Sens. 11
Implementing kurtosis in DiFX • Allocate a few extra arrays and make a few extra function calls to calculate moments about the origin • Convert to central moments and calculate kurtosis at the end of every subintegration • Getting results out is no hassle (maybe unlike clocked h/w system with less I/O) • Total development time: 1.5 hours 12
LL polarisation shown at 1/3 real time (2 second integrations, 100ms kurtosis calc) Kurtosis results A “normal”RFI-freeband fromone station 16
LL polarisation shown at 1/3 real time (2 second integrations, 100ms kurtosis calc) Kurtosis results Same bandat Hancock,where the RFI isclearlymuch worse 17
Basing flagging on a kurtosis threshold is trivial! One line of code to zero any affected channels in all baselines to given antenna Currently dumping at the “subintegration” timescale - usually of order 20ms Easy to integrate further downstream; DiFX also has a feature to manipulate data on timescales shorter than 1 subintegration Implementing kurtosis flagging 18
Correctly calculate expected value of kurtosis for 2 bit quantized input data after channelization Test the effect of kurtosis-based clipping on the interferometer output (imaging statistics) Test the implementation on a connected-element system like the EVLA (which can produce VDIF output suitable for DiFX) Work to do 19
FOV shaping; weighting subintegration (or smaller) chunks of visibility data to improve correlator FOV “filter” Other thresholding or kurtosis on autocorrelations or crosscorrelations With VLBI (or potentially EVLA) data we can record the baseband and test RFI algorithms many times in a controlled way Other RFI algorithm possibilities 20
High time resolution RFI detection and/or rejection in interferometers is an interesting and worthwhile pursuit Software correlators make testing “in-correlator” algorithms much easier! A simple kurtosis-based RFI auto-flagger will be made available in DiFX Plenty of scope for further development Conclusions 21
Questions? 22
By repeating this operation multiple times one can generate an arbitrary number of “pencil beams” (as CPU memory permits) The overhead is small compared to the costof correlating the data:generating 100s of pencil beams only requires ~3x the compute power The use of multiple FOVs primary beam Not to scale!! uv-shifted “pencil” fields 23
Low-resolution radio data can provide a flux-complete sample to be surveyed: The knownemptyspace isignored! Directing the survey primarybeam Randomcutout from the NRAO FIRSTsurvey 24
Datastream correlation flow • Start time • Valid samples • Num sent • MPI_Send * handle • Lock Read thread Requestedtime sent to Core Data buffer “Segment” “Send” Send thread FFT = 2x num channels …..
Core in pictures Baseband data fromeach telescope Read/send thread Subint visibilities Subint slot Mode objects foreach datastream Baseband data pointer Coreobject unpacked data Intermediatiate data Proc. thread XMAC Final data for XMAC Repeated for each subband Thread visibilities