Download
1 / 1
10 likes | 124 Views
Maurer, E.P. 1 , I.T. Stewart 1 , C. Bonfils 2 , P.D. Duffy 3 and D. Cayan 4 1 Santa Clara University, 2 U.C. Merced, 3 Lawrence Livermore National Lab, 4Scripps Institution of Oceanography, UCSD and WRD, USGS (. Detectability of trends towards earlier streamflow in the Sierra Nevada. 4.

E N D
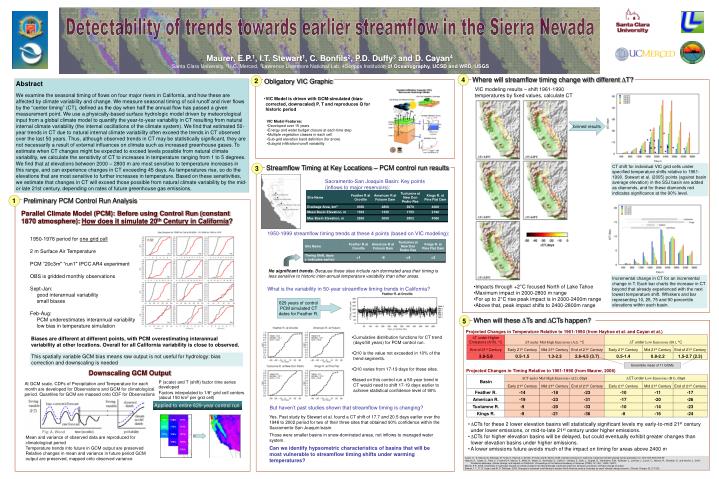
Maurer, E.P.1, I.T. Stewart1, C. Bonfils2, P.D. Duffy3 and D. Cayan4 1Santa Clara University, 2U.C. Merced, 3Lawrence Livermore National Lab, 4Scripps Institution of Oceanography, UCSD and WRD, USGS ( Detectability of trends towards earlier streamflow in the Sierra Nevada 4 Where will streamflow timing change with different T? 2 Obligatory VIC Graphic Abstract We examine the seasonal timing of flows on four major rivers in California, and how these are affected by climate variability and change. We measure seasonal timing of soil runoff and river flows by the “center timing” (CT), defined as the day when half the annual flow has passed a given measurement point. We use a physically-based surface hydrologic model driven by meteorological input from a global climate model to quantify the year-to-year variability in CT resulting from natural internal climate variability (the internal oscillations of the climate system). We find that estimated 50-year trends in CT due to natural internal climate variability often exceed the trends in CT observed over the last 50 years. Thus, although observed trends in CT may be statistically significant, they are not necessarily a result of external influences on climate such as increased greenhouse gases. To estimate when CT changes might be expected to exceed levels possible from natural climate variability, we calculate the sensitivity of CT to increases in temperature ranging from 1 to 5 degrees. We find that at elevations between 2000 – 2800 m are most sensitive to temperature increases in this range, and can experience changes in CT exceeding 45 days. As temperatures rise, so do the elevations that are most sensitive to further increases in temperature. Based on these sensitivities, we estimate that changes in CT will exceed those possible from natural climate variability by the mid- or late 21st century, depending on rates of future greenhouse gas emissions. VIC modeling results – shift 1961-1990 temperatures by fixed values, calculate CT • VIC Model is driven with GCM-simulated (bias-corrected, downscaled) P, T and reproduces Q for historic period binned results • VIC Model Features: • Developed over 15 years • Energy and water budget closure at each time step • Multiple vegetation classes in each cell • Sub-grid elevation band definition (for snow) • Subgrid infiltration/runoff variability 3 Streamflow Timing at Key Locations – PCM control run results CT shift for individual VIC grid cells under specified temperature shifts relative to 1961-1990. Stewart et al. (2005) points (against basin average elevation) in the SSJ basin are added as diamonds, and for these diamonds red indicates significance at the 90% level. Sacramento-San Joaquin Basin: Key points (inflows to major reservoirs): 1 Preliminary PCM Control Run Analysis Parallel Climate Model (PCM): Before using Control Run (constant 1870 atmosphere): How does it simulate 20th Century in California? 1950-1999 streamflow timing trends at these 4 points (based on VIC modeling): • 1950-1976 period for one grid cell • 2 m Surface Air Temperature • PCM “20c3m" “run1" IPCC AR4 experiment • OBS is gridded monthly observations • Sept-Jan: • good interannual variability • small biases • Feb-Aug: • PCM underestimates interannual variability • low bias in temperature simulation No significant trends. Because these sites include rain dominated area their timing is less sensitive to historic inter-annual temperature variability than other areas. Incremental change in CT for an incremental change in T. Each bar charts the increase in CT beyond that already experienced with the next lowest temperature shift. Whiskers and bar representing 10, 25, 75 and 90 percentile elevations within each basin. • Impacts through +2°C focused North of Lake Tahoe • Maximum impact in 2000-2800 m range • For up to 2°C rise peak impact is in 2000-2400m range • Above that, peak impact shifts to 2400-2800m range What is the variability in 50-year streamflow timing trends in California? 629 years of control PCM simulated CT dates for Feather R. 5 When will these Ts and CTshappen? Projected Changes in Temperature Relative to 1961-1990 (from Hayhoe et al. and Cayan et al.) • Cumulative distribution functions for CT trend (days/50 years) for PCM control run. • Q10 is the value not exceeded in 10% of the trend segments. • Q10 varies from 17-19 days for these sites. • Based on this control run a 50-year trend in CT would need to shift 17-19 days earlier to achieve statistical confidence level of 90% Biases are different at different points, with PCM overestimating interannual variability at other locations. Overall for all California variability is close to observed. This spatially variable GCM bias means raw output is not useful for hydrology: bias correction and downscaling is needed Ensemble mean of 11 GCMs Projected Changes in Timing Relative to 1961-1990 (from Maurer, 2006) Downscaling GCM Output P (scale) and T (shift) factor time series developed Factors interpolated to 1/8° grid cell centers (about 150 km2 per grid cell) At GCM scale, CDFs of Precipitation and Temperature for each month are developed for Observations and GCM for climatological period. Quantiles for GCM are mapped onto CDF for Observations Applied to entire 629-year control run But haven’t past studies shown that streamflow timing is changing? Yes. Past study by Stewart et al. found a CT shift of 17.7 and 20.5 days earlier over the 1948 to 2002 period for two of their three sites that obtained 90% confidence within the Sacramento-San Joaquin basin. Those were smaller basins in snow-dominated areas, not inflows to managed water system. Can we identify hypsometric characteristics of basins that will be most vulnerable to streamflow timing shifts under warming temperatures? • CTs for these 2 lower elevation basins will statistically significant levels my early-to-mid 21st century under lower emissions, or mid-to-late 21st century under higher emissions. • CTs for higher elevation basins will be delayed, but could eventually exhibit greater changes than lower elevation basins under higher emissions. • A lower emissions future avoids much of the impact on timing for areas above 2400 m Fig: A. Wood Mean and variance of observed data are reproduced for climatological period Temperature trends into future in GCM output are preserved Relative changes in mean and variance in future period GCM output are preserved, mapped onto observed variance Cayan, D., E. Maurer, M. Dettinger, M. Tyree, K. Hayhoe, C. Bonfils, P. Duffy, and B. Santer, 2006, Climate scenarios for California, California Climate Change Center publication no. CEC-500-2005-203-SF Hayhoe, K., Cayan, D., Field, C., Frumhoff, P., Maurer, E., Miller, N., Moser, S., Schneider, S., Cahill, K., Cleland, E., Dale, L., Drapek, R., Hanemann, R.M., Kalkstein, L., Lenihan, J., Lunch, C., Neilson, R., Sheridan, S., and Verville, J.: 2004, ‘Emissions pathways, climate change, and impacts on California’, Proceedings of the National Academy of Sciences (PNAS) 101 (34), 12422–12427. Maurer, E.P., 2006, Uncertainty in hydrologic impacts of climate change in the Sierra Nevada, California under two emissions scenarios, Climatic Change (in press) Stewart, I. T., D. R. Cayan, and M. D. Dettinger, 2004, Changes in snowmelt runoff timing in western North America under a 'business as usual' climate change scenario, Climatic Change, 62, 217-232