Download
1 / 16
160 likes | 347 Views
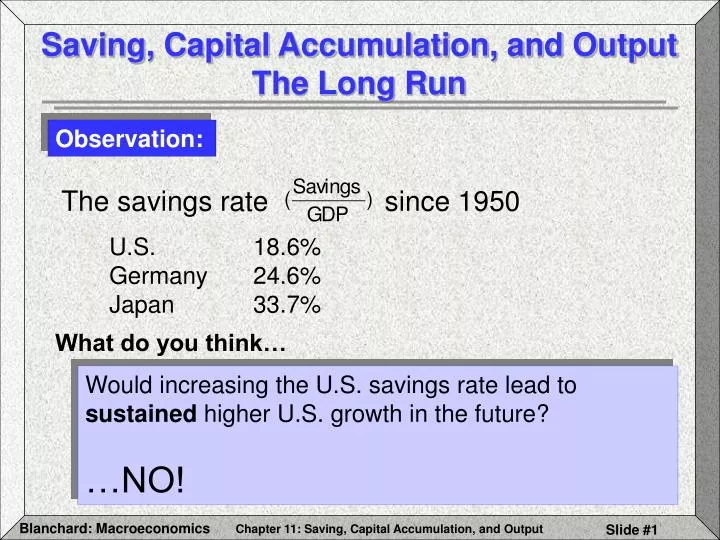
The savings rate since 1950. Saving, Capital Accumulation, and Output The Long Run. Observation:. U.S. 18.6% Germany 24.6% Japan 33.7%. What do you think…. Would increasing the U.S. savings rate lead to sustained higher U.S. growth in the future? …NO!.

E N D
The savings rate since 1950 Saving, Capital Accumulation, and OutputThe Long Run Observation: U.S. 18.6%Germany 24.6%Japan 33.7% What do you think… Would increasing the U.S. savings rate lead to sustained higher U.S. growth in the future? …NO!
Interactions between Output and Capital • Capital, Output, and Saving/Investment • The amount of capital (K) amount of output (Y) • The amount of output (Y) the amount of savings (S) & investment (I = S when G-T=0) amount of capital (K)
Interactions between Output and Capital Investment and Capital Accumulation Per worker output and capital accumulation Capital/worker in t+1 = Capital/Worker in t, adjusted for depreciation and investmentInvestment/worker = Savings rate x Output/worker in t
- = Change in capitalfrom year t to year t+1 Invest-ment during year t depreciationduring year t Implications of Alternative Saving Rates Dynamics of Capital and Output: The change in Kapital/worker from t to t+1 depends on Investment/Worker – Depreciation/Worker
Depreciation per worker Kt/N Output per worker f(Kt/N) Y*/N B Investment per worker sf(Kt/N) C D A Implications of Alternative Saving Rates Dynamics of Capital and Output Graphically Output per worker, Y/N AB = Output/worker AC = Investment/worker AD = Depreciation AC > AD (Ko/N) K*/N Capital per worker, K/N
Steady-State Value of Capital/Worker: Investment just offsets depreciation Steady-State Value of Output/Worker Implications of Alternative Saving Rates Steady-State Capital and Output
Depreciation per worker Kt/N Output per worker f(Kt/N) D Y1/N B Investment s0f(Kt/N) Investment s1f(Kt/N) Y0/N C I > Output per worker, Y/N A (K0/N) K1/N Capital per worker, K/N Implications of Alternative Saving Rates The Effects of Different Saving Rate
Y1/N Output per worker, Y/N Y0/N Time Implications of Alternative Saving Rates The Effects of Different Saving Rate (No technological progress) Associated with saving rate s1 > s0 Associated with saving rate s0 t
Associated with saving rate s1 > s0 Output per worker, Y/N (log scale) Associated with saving rate s0 Time Implications of Alternative Saving Rates The Effects of Different Saving Rate (Technological progress) t
Implications of Alternative Saving Rates The Savings Rate and the Golden Rule Does an increase in saving lead to an increase inconsumption in the long run? Two Scenarios: • Saving Rate = 0 • Capital = 0 • Output = 0 • Consumption = 0 • Saving Rate = 1 • Consumption = 0 • Output replaces depreciation
Maximum steady state Consumption per worker: At Golden Rule Level of Capital Consumption per worker, C/N Saving rate, s Implications of Alternative Saving Rates sG 0 1
Assume: (Constant return to scale and decreasing returns to either capital or labor) Getting a Sense of Magnitudes
In steady-state is constant and the left side= 0 and: Getting a Sense of Magnitudes Then
Higher saving rate and lower depreciation bothlead to higher and in the long run. Double s Quadruple K/N and double Y/N Getting a Sense of Magnitudes The Effects of the Saving Rate on Steady-State Output Steady-State Output/Worker:
Getting a Sense of Magnitudes The U.S. Saving Rate and the Golden Rule What saving rate that would maximize steady-state consumption? In Steady-State:
Getting a Sense of Magnitudes The U.S. Saving Rate and the Golden Rule Observation If s < .50: increasing s will increase long-run consumption In the U.S., s < 20%