Download
1 / 34
340 likes | 346 Views
Explore how environmental factors impact barnacle populations using density and abundance measures. Learn growth models and analyze population dynamics over time.

E N D
Population dynamics - studies the size and age compositions of populations and the environmental processes affecting them. Generate and evaluate mathematical models Growth rates Carrying capacity Density dependence Density independence Collect and analyze descriptive data Density Abundance Birth rates Death rates
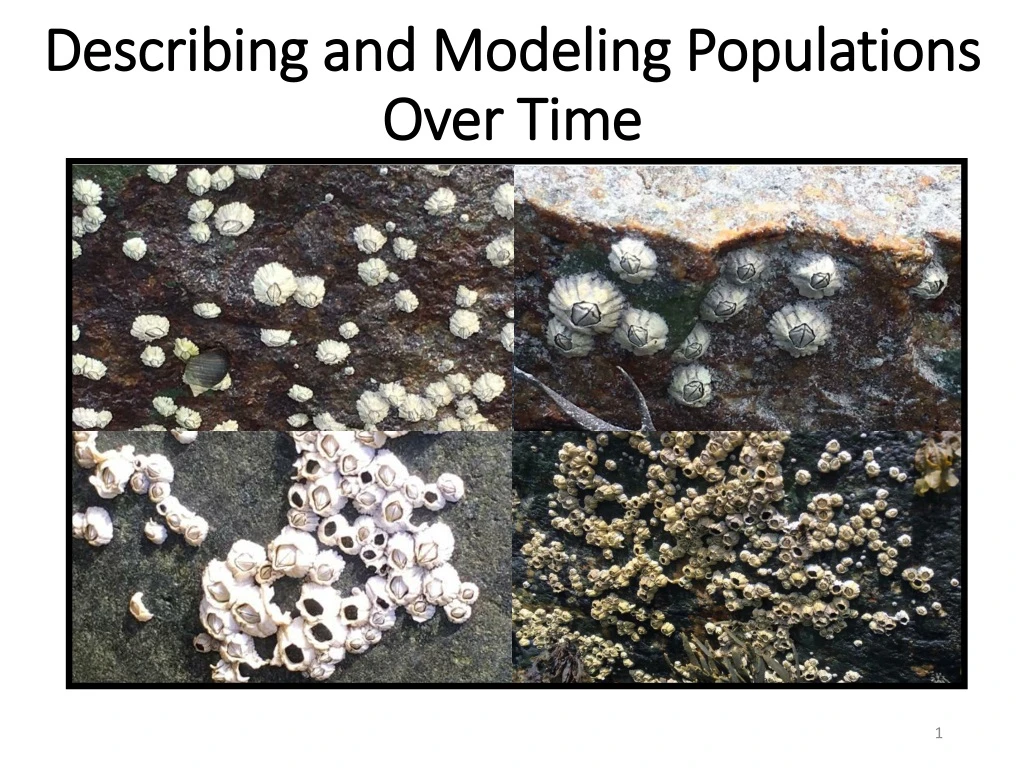
Studying barnacles provided important understanding to the developing field of ecology Why barnacles? Stationary marine animals that live in the intertidal zone - Begin their life as larva floating in the water - Settle and live cemented on hard surfaces (e.g., rocks) - Feed on plentiful plankton in the water Stationary = easy to count and observe over time
Barnacle population size is impacted by a number of different factors Parasites People Disease Number of barnacles Predation Pollution Competition Temperature Space
Different measures of population size can be used depending on the study organism Ecologists can measure : Total number of individuals in the population Abundance Total number of individuals per unit area or volume Density
CQ1. Which of the following statements describes the two study sites below? Site 2 has a greater abundance and density than site 1. Site 1 has a lower abundance but equal density to site 2. Site 1 has a lower abundance but greater density than site 2. The density and abundance are equal for both sites. Abundance Site 1 Area= 4 cm2 Site 2 Area= 8 cm2
CQ1. Which of the following statements describes the two study sites below? Site 2 has a greater abundance and density than site 1. Site 1 has a lower abundance but equal density to site 2. Site 1 has a lower abundance but greater density than site 2. The density and abundance are equal for both sites. Abundance Site 1 Area= 4 cm2 Site 2 Area= 8 cm2
Abundance is the total number of individuals in the population 1 2 Site 1 Abundance 5 Abundance barnacles 3 4 5 Site 1 Area= 4 cm2 Site 2 Abundance 4 3 1 2 8 barnacles 6 5 7 8 Site 2 Area= 8 cm2
Density is the total number of individuals per unit area or volume 1 2 Abundance Site 1 Density 3 4 5 D= 1.25 barnacles per cm2 Site 1 Area= 4 cm2 Site 2 Density 4 3 1 2 6 5 7 8 D= 1 barnacle per cm2 Site 2 Area= 8 cm2
In this study, density was used to measure barnacle population size over time Empty rocks were placed in the intertidal zone. Cages were placed on the rocks to prevent predation. The population of settling barnacles on these rocks was observed daily for the month of April. End of April Beginning of April Connell, J. 1961. Effects of competition, predation by Thais lapillus, and other factors on natural populations of the barnacle Semibalanusbalanoides. Ecological Society of America, 31: 61-104.
TPSQ2. Draw on your paper what you would expect the growth of this population to look like over the 30 day experiment.
CQ2. Select the growth curve that most resembles your prediction for barnacle population growth. A. C. B.
TPSQ3. Use the data provided to plot the barnacle population growth.
CQ3. Select the growth curve that most resembles the plot you generated from the data provided. A. C. B. exponential linear logistic
CQ3. Select the growth curve that most resembles the plot you generated from the data provided. A. C. B. exponential linear logistic
Growth models can simplify the complexity of ecology exponential linear logistic dN/dt = population growth rate= rate of change in the number of individuals in the population or density of the population
CQ4. The population growth rate (or change in population density) is: exponential linear logistic • increasing over time in all three growth curves. • increasing over time in the linear and exponential growth curves only. • constant over time in all three growth curves. • constant in the linear growth curve and changes over time in the exponential and logistic growth curves.
CQ4. The population growth rate (or change in population density) is: exponential linear logistic • increasing over time in all three growth curves. • increasing over time in the linear and exponential growth curves only. • constant over time in all three growth curves. • constant in the linear growth curve and changes over time in the exponential and logistic growth curves.
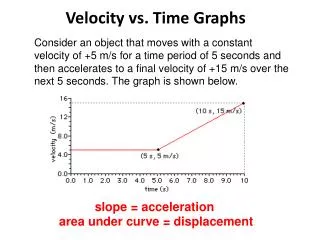
In linear growth, the population growth rate is constant over time Linear Model: Population growth rate 2 linear 1 N= population size measured by density (# per cm2) t= time (days) N1= 30 barnacles per cm2 t1=10 days N2= 78 barnacles per cm2 t2=25 days A constant number of individuals are being added over time. (dN/dt)= (78-30) / (25-10) Population growth rate constant (Same at every point in time) (dN/dt)= (48/15) (dN/dt)= +3.2 barnacles per cm2/ day
In exponential growth, the population growth rate is increasing continuously Exponential Model: Population growth rate N= population size (# per cm2) t= time (days) r = rate of intrinsic population increase r = birth rate – death rate (in barnacles r = settlement rate – death rate) r= 1 per day per individual An increasing number of individuals are being added over time. r= 2 per day per individual Population growth rate increasing continuously r= 3 per day per individual
In exponential growth, the population growth rate is increasing continuously Exponential Model: Population growth rate If r = 2 per day: When N= 1 barnacles per cm2 (dN/dt)= +2 barnacles per cm2/ day An increasing number of individuals are being added over time. When N= 10 barnacles per cm2 (dN/dt)= +20 barnacles per cm2/ day When N= 100 barnacles per cm2 (dN/dt)= Population growth rate increasing continuously +200 barnacles per cm2/ day
Add in 80/cm2 as carrying capacity number? Barnacle population growth was limited by carrying capacity Carrying capacity (~80 barnacles per cm2) The maximum number of individuals a particular habitat can sustain indefinitely given the amount of available resources. Connell, 1961
Add in 80/cm2 as carrying capacity number? In this study, space was likely a density-dependent regulating mechanism Carrying capacity (~80 barnacles per cm2) Regulating mechanisms influence the population growth rate. Density-dependentregulation occurs when per capita growth rates are influenced by the density of a population. Connell, 1961
In logistic growth, the population growth rate increases then decreases over time Logistic Model: Population growth rate logistic r = settlement rate – death rate N= population size K= carrying capacity K=The maximum number of individuals a particular habitat can sustain indefinitely given the amount of available resources. K=~80 barnacles per cm2 An increasing number of individuals are added initially, then a decreasing number of individuals added over time. Population growth rate increasing, then decreasing
CQ5. If r=2 per day per individual and K= 80 barnacles per cm2, how does increasing the population size (N) affect the population growth rate (dN/dt) in the logistic model? Hint: Calculate the population growth rate for the following population sizes and focus on what occurs as N gets close to K. Population growth rate dN/dt = growth rate r= rate of intrinsic population increase N= population size K= carrying capacity N approaches K • As N approaches K, the population growth rate increases. • As N approaches K, the population growth rate slows. • As N approaches K, the population growth rate stays constant.
CQ5. If r=2 per day per individual and K= 80 barnacles per cm2, how does increasing the population size (N) affect the population growth rate (dN/dt) in the logistic model? Population growth rate Logistic Model: Example calculation N= 40 barnacles per cm2
CQ5. If r=2 per day per individual and K= 80 barnacles per cm2, how does increasing the population size (N) affect the population growth rate (dN/dt) in the logistic model? Population growth rate logistic • As N approaches K, the population growth rate increases. • As N approaches K, the population growth rate slows. • As N approaches K, the population growth rate stays constant.
The data collected show a population growth rate that increases then decreases over time Carrying capacity 0 barnacles per cm2 /day +2 barnacles per cm2 /day +22 barnacles per cm2 /day +8 barnacles per cm2 /day +2 barnacles per cm2 /day
Different mathematical models describe how population growth rate changes over time exponential linear logistic A constant number of individuals are being added over time. An increasing number of individuals are being added over time. An increasing number of individuals are added initially, then a decreasing number of individuals added over time. Population growth rate constant Population growth rate increasing Population growth rate increasing, then decreasing
Population models can be used to simplify the complexity of many different organisms Bristlecone pine Gray wolf Place picture of Bristlecone pine tree Place picture of a gray wolf Bacteria in a flask Red fox Place picture of bacteria in a flask Place picture of a red fox
TPSQ4: Describe the following populations over timeusing the following guidelines: Identify if density or abundance is shown. Describe what is happening to the population (increasing, decreasing, etc.). Identify if the graph most closely resembles linear, exponential, logistic growth, or other. Place picture of Bristlecone pine tree Place picture of a gray wolf Place picture of bacteria in a flask Place picture of a red fox
Abundance • The population size is not changing over time. • Linear • Abundance • Population size is increasing at an increasing rate. • Exponential • Density • Population size is increasing fast at first then slowing. • Logistic Abundance The population size is fluctuating over time at varying rates. Other
Scientists measure, describe, and model populations over time 1. Population ecologists collect and analyze descriptive data (density, abundance, birth/settlement rates, death rates). 2. Mathematical models can be used to describe population growth. 3. Many (but not all) populations can be modeled using logistic, density-dependent growth where growth rates slow as the population approaches carrying capacity.


![T ime after irradiation [h]](https://cdn2.slideserve.com/3752334/slide1-dt.jpg)