Download
1 / 14
140 likes | 294 Views
“ How Do You Know What I Know?” Representing Your Data. Matthew Sender Mentor: Dr. Grant Krow Teacher: Maria Fitzgerald. First Step, Proper Data Collection. What data should we collect? The data you collect should allow you to answer the question you are investigating.

E N D
“How Do You Know What I Know?”Representing Your Data Matthew Sender Mentor: Dr. Grant Krow Teacher: Maria Fitzgerald
First Step, Proper Data Collection What data should we collect? The data you collect should allow you to answer the question you are investigating. How should we collect our data? Proper data collection is methodical,rather than haphazard.
A Record Book Is Essential! Record Book • Plan your experiment before you begin • This includes: • What materials you will need • Step by step procedural guide • Space to record your observations • Just like your school lab book • The big difference is that you are designing the experiment
How Do You Investigate a Question? • Questions are investigated by careful control of the experimental conditions such that only “the thing” being studied is changing. • Another essential piece is to have a control experiment. • A Control experiment is one in which the experiment is carried out without including the variable.
What About the Precision and Accuracy of Our Data? • In order to assess the precision of our data we need to run each experiment more than once • Optimally 3-5 times for each experiment • In order to properly assess the accuracy of our data we need to know the “true” value of whatever we are measuring.
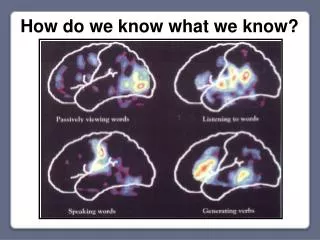
How Do We Represent Our Data Now That It Is Collected? Figures and Tables! • Figures, such as graphs, are very effective at showing trends and relationships • Figures, such as diagrams or pictures, are effective at showing visual data, or experimental apparatus • Tables are very effective at showing values for comparison.
Let’s Spice It Up Question to be studied- What is the effect of flame height on the heating curve of water? What do we have to do so that we collect quality data to answer our question?
Method Data Materials
Method Add 50 mL of water to cup Light Bunsen burner and adjust flame to 4 inches Place cup 5 inches from top of Bunsen burner Record temperature every minute until the temperature is constant, then continue to heat and observe for 3 minutes. Repeat 2X, then repeat 3X each adjusting the flame height to 5 and 6 inches Data To Record: Flame Height, Trial ,Time, Temperature Materials • Stopwatch • Heatable cup with volume markings • Ruler • Bunsen burner • Gas supply • 1 L of bottled water • Stand • Clamp • Thermometer How many variables in our method can we find? How many are we changing?
Fake “Collected” Data Which flame height has the fastest rate of heating?
Tables Can Be Very Effective As Well Even graphs can be made more succinct if you are able to get the right information out of your data