Download
1 / 19
210 likes | 240 Views
ImageJ from NIH is a powerful Java image processing tool with many implemented operations for prototyping and testing. It allows writing plugins and custom algorithms efficiently, such as point processes and linear transformations. The tool includes features like histogram analysis, contrast enhancement, and locally adaptive histogram equalization. Learn about applying masks, mathematical representations of mask operations, common mask types like "blur," boundary effects, and median filtering for edge preservation.

E N D
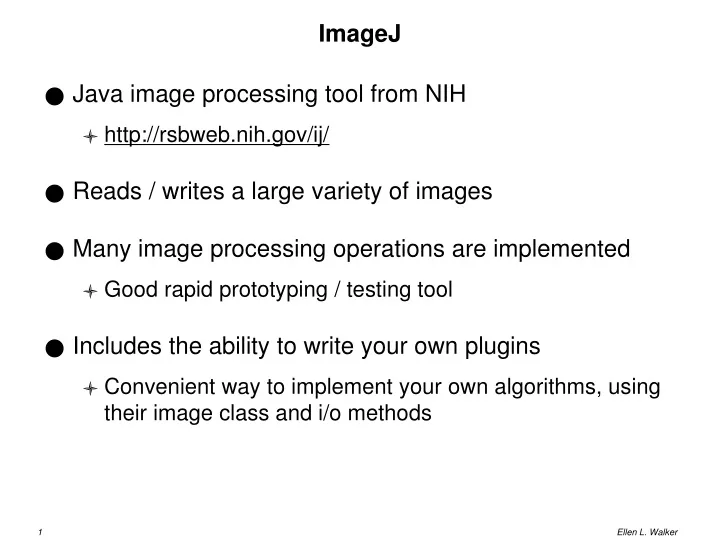
ImageJ • Java image processing tool from NIH • http://rsbweb.nih.gov/ij/ • Reads / writes a large variety of images • Many image processing operations are implemented • Good rapid prototyping / testing tool • Includes the ability to write your own plugins • Convenient way to implement your own algorithms, using their image class and i/o methods
Point Processes • Pixel by pixel transformation • Output pixel depends only on corresponding input pixel • Examples: • Out(r,c) = In(r,c) * 1.25 • Out(r,c) = In(r,c) + 25 • Out(r,c) = (In(r,c))2
Linear Transformations • Out(r,c) = In(r,c) * gain + bias • Gain controls contrast • Bias controls brightness • Location dependent: • Out(r,c) = In(r,c) * gain(r,c) + bias(r,c) • E.g. “sky darkening filter” • Linear Blend • Out(r,c) = (lambda) * In1(r,c) + (1-lambda) * In2(r,c) • If In1 and In2 are images, a sequence of these from lambda = 0 to lambda=1 is an image dissolve
Histogram • An image histogram counts the number of pixels at each brightness. • Color images have 3 histograms (red, green, blue)
Information in Histogram • Contrast (variation in brightness) • Are bars spread over the whole range? • Foreground vs. background color • Are there two separate “peaks” with a valley between?
Applications of Histogram • Thresholding • Find a value that separates foreground / background values • Look for a “valley” between two peaks (may or may not be what you need) • Contrast enhancement • Histogram equalization – spread the data as evenly through the histogram as possible • Goal: wide, flat histogram
Example: Histogram Equalization • Original • Modified
Algorithm: Histogram Equalization • Find cumulative distribution • For each intensity I, c(I) = # pixels <= I • Code: C[0]=Hist[0]; For(greylevel =1; greylevel < max; greylevel++){ C[greylevel] = Hist[greylevel] + C[greylevel-1]; C[greylevel] = C[greylevel] / (double)(rows*cols); }
Algorithm: Histogram Equalization • Use C(I) as a lookup table to determine the final value of each pixel. • Since C(I) ranges from 0 to 1 (why?), multiply C(I) by the max pixel value to get the output value • Code: For(r=0;r<rows;r++) for(c=0;c<cols;c++) out[r][c] = C[(in[r][c])]*MAX;
Locally Adaptive Histogram Equalization • Instead of doing histogram equalization using the whole image, compute the distribution for a moving window around the given pixel. • Avoids effect of bright light at one corner washing out everything in the image.
N W E S Image Neighborhoods • Neighborhoods can be defined for each pixel • The two most common neighborhoods • 4-neighborhood • 8-neighborhood
Applying a Mask • Mask is a set of relative pixel positions. One is designated the origin (0,0) - usually at center • Each mask element is weighted • To apply the mask, put the origin pixel over the image pixel and multiply weights by the pixels under them, then add up all the values. • Usually this is repeated for every pixel in the image . Assumptions must be made for pixels near the edge of the image.
Mask application example • Result is 0 0 0 1 1 0 0 1 2 2 0 1 2 3 2 1 2 3 3 2 2 3 3 3 2 Boundary pixels are gray • Mask = 1 1 1 • Apply to every pixel in image: 0 0 0 0 1 0 0 0 1 1 0 0 1 1 1 0 1 1 1 1 1 1 1 1 1
Mathematical Representation of Mask Operations • Equation from Chapter 3 • g is the output image • f is the input image • h is the mask (also called kernel) • Short form (convolution operator)
Masks that "blur" • "Box mask" - every pixel gets the average of its neighborhood 1 1 1 After computing, divide by 9 (mask sum) 1 1 1 to keep image from getting too bright 1 1 1 • "Weighted average" - divide by 16 after application 1 2 1 2 4 2 1 2 1
Why blur? • Avoid effects of small random noise (“salt and pepper”) • Remove small features to emphasize larger ones • Bigger masks blur more / remove larger features • Sequence of masks generates sequence of increasingly blurred images (useful for some matching algorithms) • First step in sharpening the image (!) Sharp(x,y) = orig(x,y) + gamma (orig(x,y) – (blur * orig(x,y)))
Boundary Effects (padding) Figure 3.12
Common Masks Figure 3.13
Median Filtering • Example of a non-linear filter • Replace the central pixel of a window with the median pixel of the window • Compare to box filter, which replaces with average value in the window • Tends to preserve edges (why?)