Download
1 / 14
300 likes | 1.04k Views
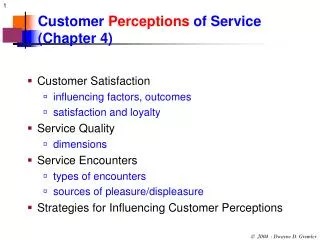
Chapter 5 --- Understanding Customer Expectations and Perceptions Through Marketing Research. Donna J. Hill, Ph.D. Fall 2000. Provider GAP 1. CUSTOMER. Expected Service. GAP 1. Company Perceptions of Consumer Expectations. COMPANY. Part 2 Opener. Common Research Objectives for Services .

E N D
Chapter 5 --- Understanding Customer Expectations and Perceptions Through Marketing Research Donna J. Hill, Ph.D. Fall 2000
Provider GAP 1 CUSTOMER Expected Service GAP 1 Company Perceptions of Consumer Expectations COMPANY Part 2 Opener
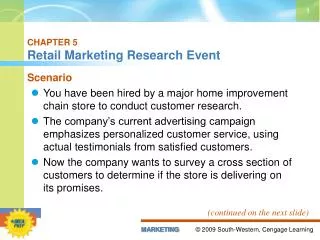
Common Research Objectives for Services • To identify dissatisfied customers • To discover customer requirements or expectations • To monitor and track service performance • To assess overall company performance compared to competition • To assess gaps between customer expectations and perceptions • To gauge effectiveness of changes in service • To appraise service performance of individuals and teams for rewards • To determine expectations for a new service • To monitor changing expectations in an industry • To forecast future expectations
Research --- Key Vehicle for Understanding Expectations and Perceptions • Most critical stage -- defines the problem and research objectives • Eight Key Criterion for an Effective Research Program
Figure 5-1Criteria for An Effective Services Research Program Includes Quantitative Research Includes Qualitative Research Includes Perceptions and Expectations of Customers Occurs with Appropriate Frequency Research Objectives Includes Measures of Loyalty or Behavioral Intentions Measures Priorities or Importance Balances Cost and Value of Information Includes Statistical Validity When Necessary
Qualitative Research • Qualitative research is conducted to clarify problem definition and prepare for more formal empirical research • complaint solicitation • critical incident studies • requirements research • service expectation meetings and reviews • ethnography studies • customer panels ? • Lost customer research • future expectations research
Quantitative Research • Also called descriptive or empirical research can be used to test hypothesis • Relationship surveys (SERQUAL is a type) • Trailer Calls (Post-transaction surveys) • Process checkpoint evaluations • Mystery shopping • Database marketing research
Measures Priorities or Importance • Direct importance measures • Indirect importance measures
Portfolio of Services Research Type of Research Research Objective Identify dissatisfied customers to attempt recovery; identify most common categories of service failure for remedial action Customer Complaint Solicitation “Relationship” Surveys Post-Transaction Surveys Customer Focus Groups “Mystery Shopping” of Service Providers Employee Surveys Lost Customer Research Assess company’s service performance compared to competitors; identify service-improvement priorities; track service improvement over time Obtain customer feedback while service experience is still fresh; act on feedback quickly if negative patterns develop Use as input for quantitative surveys; provide a forum for customers to suggest service-improvement ideas Measure individual employee service behaviors for use in coaching, training, performance evaluation, recognition and rewards; identify systemic strengths and weaknesses in service Measure internal service quality; identify employee-perceived obstacles to improve service; track employee morale and attitudes Determine the reasons why customers defect To forecast future expectations of customers To develop and test new service ideas Future Expectations Research
Stages in the Research Process • Stage 1 : Define Problem • Stage 2 : Develop Measurement Strategy • Stage 3 : Implement Research Program • Stage 4 : Collect and Tabulate Data • Stage 5 : Interpret and Analyze Findings • Stage 6 : Report Findings
SERVQUAL • A type of relationship survey • Uses 21 questions based on five dimensions. (asked twice, once for expectation and once for perception. • Compute the difference between the ratings customers assign to the paired expectation/perception statements. • Uses mean scores on statements making up dimension • See appendix on pages 135-136
Zone of Tolerance Charts • Used to report findings on two levels of customer expectations • desired service and • adequate service • Along with customer perceptions of company performance
Figure 5-6 Service Quality Perceptions Relative to Zones of Tolerance by Dimensions 9 8 7 6 5 4 3 2 1 0 O O O O O Reliability Responsiveness Assurance Empathy Tangibles O Zone of Tolerance S.Q. Perception Retail Chain
Figure 5-6 Importance/Performance Matrix HIGH High Leverage Attributes to Improve Attributes to Maintain Importance Low Leverage Attributes to Maintain Attributes to De-emphasize LOW HIGH Performance