Download
1 / 13
130 likes | 219 Views
Financial Dashboard Jason Young. Why did we develop?. Information overload Efficiencies Easy way to calculate ratios. What banks wanted…. Trending on past performance Easy to use and navigate charts and graphs One place to see a snapshot of the daily activities of the bank. How it Works.

E N D
Why did we develop? Information overloadEfficienciesEasy way to calculate ratios Computer Services, Inc. | CEO Conference 2012
What banks wanted… Trending on past performanceEasy to use and navigate charts and graphsOne place to see a snapshot of the daily activities of the bank Computer Services, Inc. | CEO Conference 2012
How it Works Easy to use printing of graphs Color coded indicators reflect changes from previous day Application Summaries for Loans, DDA, SAV, and TDA Computer Services, Inc. | CEO Conference 2012
Additional Features 13 month rolling trends of EOM stats Calculation of 10 Key Performance Indicators w/ trendsFinancial Category breakdown w/ trending Computer Services, Inc. | CEO Conference 2012
Financial Dashboard Assigned Service in NuPointCombine over 100 Executive Reports into easy to use and navigate graphs & chartsLinks to FMS, Executive View, NuView, and Centerview built in Computer Services, Inc. | CEO Conference 2012
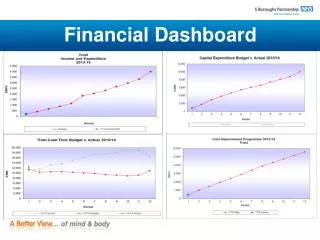
Financial Dashboard Computer Services, Inc. | CEO Conference 2012
Financial Dashboard Computer Services, Inc. | CEO Conference 2012
Financial Dashboard Computer Services, Inc. | CEO Conference 2012
Financial Dashboard Computer Services, Inc. | CEO Conference 2012
Financial Dashboard Computer Services, Inc. | CEO Conference 2012
Financial Dashboard Computer Services, Inc. | CEO Conference 2012
Financial Dashboard Jason YoungProduct Manager1-800-545-4274 ext 10362Jason.young@csiweb.com Computer Services, Inc. | CEO Conference 2012