Download
1 / 20
200 likes | 439 Views
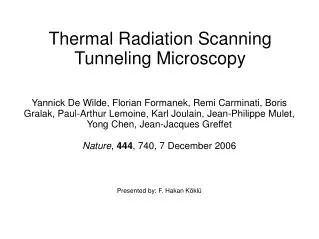
Fault Detection by a Seismic Scanning Tunneling Macroscope. G.T. Schuster, Sherif Hanafy , Ge Zhan, and Yunsong Huang. Outline. Introduction. Field Test Location of the site Tomogram Ground Truth Super Resolution Results Summary and Conclusions. Resolution. L. X. Z. Depth.

E N D
Fault Detection by a Seismic Scanning Tunneling Macroscope G.T. Schuster, SherifHanafy, Ge Zhan, and Yunsong Huang
Outline • Introduction. • Field Test • Location of the site • Tomogram • Ground Truth • Super Resolution Results • Summary and Conclusions
Resolution L X Z Depth Relight resolution Δx Abbe resolution Super resolution?
Evanescent Wave An evanescent wave is a near-field standing wave with an intensity that exhibits exponential decay with distance from the source at which the wave was formed. Wikipedia.org Decay Curve Amplitude ~ λ Offset Evanescent Wave Propagation wave Both propagation and evanescent waves are recorded Only propagation wave is recorded
Evanescent to Propagation Wave An evanescent wave is a near-field standing wave with an intensity that exhibits exponential decay with distance from the source at which the wave was formed. Wikipedia.org Decay Curve Amplitude ~ λ Offset Super resolution Propagation wave Relight resolution
Outline • Introduction. • Field Test • Location of the site • Tomogram • Ground Truth • Super Resolution Results • Summary and Conclusions
Field Test • Data Collected at Washington Fault Area, north of Arizona, USA. • 6 Lines of receivers • 80 receivers/line at 1 m receiver interval • 40 shots/line at 2 m shot interval • Total number of receivers = 480 • Total number of shots = 240
Site and Data Collection Topography In line offset: 1-2m Cross line offset: 1.5 m No. of receivers: 480 No of shots: 240
Super Resolution Test Fault Pixel size: 2 x 1.5 m2 Wavelength: 10 m
Super Resolution Results Fault
Super Resolution Results Fault Migration Image – Traces within λ are muted Migration Image – Traces within 0.8 λ are muted Migration Image – Traces within 0.4 λ are muted Migration Image – Traces within 0.1 λ are muted Migration Image using All Traces
Outline • Introduction. • Field Test • Location of the site • Tomogram • Ground Truth • Super Resolution Results • Summary and Conclusions
Summary and Conclusions • In conventional seismic method, Relight formula controls the subsurface resolution • Evanescent wave can provide much higher resolution, but it exhibits exponential decay • Scatter points can convert Evanescent wave to propagation wave Decay Curve Amplitude ~ λ Offset Relight resolution Super resolution Propagation wave Relight resolution