Download
1 / 158
2.08k likes | 3.23k Views
The Expression of Uncertainty in Measurement. Bunjob Suktat JICA Uncertainty Workshop January 16-17, 2013 Bangkok, Thailand. Acceptance of the Measurement Results. Contents. Introduction GUM Basic Concepts Basic Statistics Evaluation of Measurement Uncertainty

E N D
The Expression of Uncertainty in Measurement Bunjob Suktat JICA Uncertainty Workshop January 16-17, 2013 Bangkok, Thailand
Contents • Introduction • GUM Basic Concepts • Basic Statistics • Evaluation of Measurement Uncertainty • How is Measurement Uncertainty estimated? • Reporting Result • Conclusions and Remarks
Introduction • Guide to the Expression of Uncertainty in Measurement was published by the International Organization for Standardization in 1993 in the name of 7 international organizations • Corrected and reprinted in 1995 • Usually referred to simply as the “GUM”
Guide to the Expression of Uncertainty in Measurement (1993) BIPM - International Bureau of Weights and Measures http//: www.bipm.org International Organisations IEC - International Electrotechnical Commision http//: www.iec.ch IFCC - International Federation of Clinical Chemistry http//: www.ifcc.org IUPAP - International Union of Pure and Applied Physics http//: www.iupap.org IUPAC - International Union of Pure and Applied Chemistry http//: www.iupac.org ISO - International Organisation for Standardisation http//: www.iso.ch OIML - International Organisation for legal metrology http//: www.oiml.org
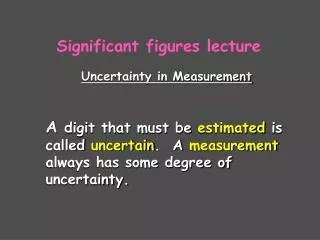
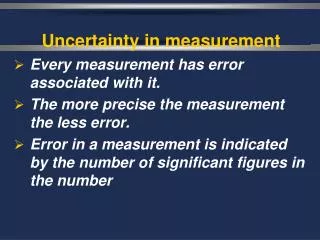
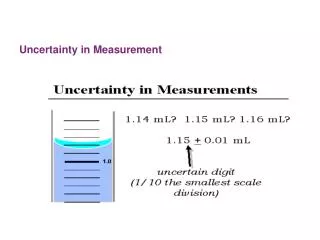
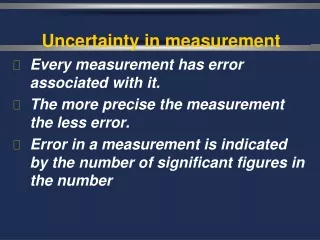
Basic concepts • Every measurement is subject to some uncertainty. • A measurement result is incomplete without a statement of the uncertainty. • When you know the uncertainty in a measurement, then you can judge its fitness for purpose. • Understanding measurement uncertainty is the first step to reducing it
Introduction to GUM • When reporting the result of a measurement of a physical quantity, it is obligatory that some quantitative indication of the quality of the result be given so that those who use it can assess its reliability. • Without such an indication, measurement results can not be compared, either among themselves or with reference values given in the specification or standard. GUM 0.1
Stated Purposes • Promote full information on how uncertainty statements are arrived at • Provide a basis for the international comparison of measurement results
Benefits • Much flexibility in the guidance • Provides a conceptual framework for evaluating and expressing uncertainty • Promotes the use of standard terminology and notation • All of us can speak and write the same language when we discuss uncertainty
Uses of MU • QC & QA in production • Law enforcement and regulations • Basic and applied research • Calibration to achieve traceability to national standards • Developing, maintaining, and comparing international and national reference standards and reference materials • GUM 1.1
After uncertainty evaluation No uncertainty evaluation (only precision) value 12.5 12.0 11.5 mg kg-1 11.0 10.5 R1 R2 R1 R2 R1 R2 Are these results different?
En-score according to GUM “Normalized” versus ... propagated combined uncertainties • Performance evaluation: • 0 <|En|< 2 : good • 2 <|En|< 3 : warning preventive action • |En|>3 : unsatisfactory corrective action
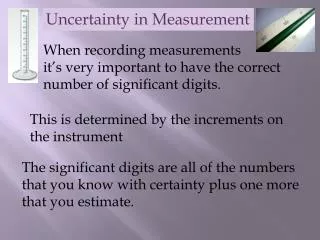
What is Measurement? Measurement is ‘Set of operations having the object of determining a value of a quantity.’ ( VIM 2.1 ) Note: The operations may be performed automatically.
Basic concepts • Measurement • the objective of a measurement is to determine the value of the measurand, that is, the value of the particular quantity to be measured • a measurement therefore begins with • an appropriate specification of the measurand • the method of measurement and • the measurement procedure GUM 3.1.1
Principles of Measurement Method of Comparison DUT Result Standard
Basic concepts • Result of a measurement • is only an estimate of a true value and only complete when accompanied by a statement of uncertainty. • is determined on the basis of series of observations obtained under repeatabilityconditions • Variations in repeated observations are assumed to arise becauseinfluence quantities GUM 3.1.2 GUM 3.1.4 Gum 3.1.5
Influence quantity • Quantity that is not the measurand but that affects the result of measurement. • Example : temperature of a micrometer used to measure length. ( VIM 2.7 )
What is Measurement Uncertainty? • “parameter, associated with the result of a measurement, that characterizes the dispersion of the values that could reasonably be attributed to the measurand” – GUM, VIM • Examples: • A standard deviation (1 sigma) or a multiple of it (e.g., 2 or 3 sigma) • The half-width of an interval having a stated level of confidence
Uncertainty • The uncertainty gives the limits of the range in which the “true” value of the measurand is estimated to be at a given probability.. • Measurement result = Estimate ± uncertainty • (22.7 ± 0.5) mg/kg • The value is between 22.2 mg/kg and 23.2 mg/kg
Measurement Error Measurement Error Real Number System Measured Value True Value Measured values are inexact observations of a true value. The difference between a measured value and a true value is known as the measurement error or observation error.
Basic concepts • The error in a measurement • Measured value – True value. • This is not known because: • The true value for the measurand • This is not known • The result is only an estimate of a true value and only complete when accompanied by a statement of uncertainty. GUM 2.2.4 GUM 3.2.1
Random & Systematic Errors • Error can be decomposed into random and systematic parts • The random error varies when a measurement is repeated under the same conditions • The systematic error remains fixed when the measurement is repeated under the same conditions
Random error • Result of a measurement minus the mean result of a large number of repeated measurement of the same measurand. ( VIM 3.13 )
Random Errors • Random errors result from the fluctuations in observations • Random errors may be positive or negative • The average bias approaches 0 as more measurements are taken
Random error • Presumably arises from unpredictable temporal and spatial variations • gives rise to variations in repeated observations • Cannot be eliminated, only reduced. GUM 3.2.2
Systematic Errors Mean result of a large number of repeated measurements of the same measurand minus a true value of the measurand. ( VIM 3.14 )
Systematic Errors • A systematic error is a consistent deviation in a measurement • A systematic error is also called a bias or an offset • Systematic errors have the same sign and magnitude when repeated measurements are made under the same conditions • Statistical analysis is generally not useful, but rathercorrections must be made based on experimental conditions.
Systematic error • If a systematic error arises from a recognized effect of an influence quantity • the effect can be quantified • can not be eliminated, only reduced. • if significant in size relative to required accuracy, a correction or correction factor can be applied to compensate • then it is assumed that systematic error is zero. GUM 3.2.3
Basic concepts Systematic error • It is assumed that the result of a measurement has been corrected for all recognised significant systematic effects GUM 3.2.4
Measurement Error Systematic error Random error
Correcting for Systematic Error • If you know that a substantial systematic error exists and you can estimate its value, include a correction (additive) or correction factor (multiplicative) in the model to account for it • Correction - Value that , added algebraically to the uncorrected result of a measurement , compensates for an assumed systematic error (VIM 3.15) • Correction Factor- numerical factor by which the uncorrected result of a measurement is multiplied to compensate for systematic error. [VIM 3.16]
Uncertainty • The result of a measurement after correction for recognized systematic effects is still only an estimateof the value of the measurand because of the uncertainty arising; • from random effects and • from imperfect correction of the result for systematic effects GUM 3.3.1
Classification of effects and uncertainties • Random effects • Unpredictable variations of influence quantities • Lead to variations in repeated measurements • Expected value : 0 • Can be reduced by making many measurement • Systematic effects • Recognized variations of influence quantities • Lead to BIAS in repeated measurements • Expected value : unknown • Can be reduced by applying a correction which carries an uncertainty
Error versus uncertainty • It is important not to confuse the terms error and uncertainty • Error is the difference between the measured value and the “true value” of the thing being measured • Uncertaintyis a quantification of the doubt about the measurement result • In principle errors can be known and corrected • But any error whose value we do not know is a source of uncertainty.
Blunders • Blunders in recording or analysing data can introduce a significant unknown error in the result of a measurement. • Measures of uncertainty are not intended to account for such mistakes GUM 3.4.7
Population and Sample Samples • Parent Population The set of all possible measurements. • Sample A subset of the population - measurements actually made. Handful of marbles from the bag Population Bag of Marbles Slide 7
Histograms • When making many measurements, there is often variation between readings. Histogram plots give a visual interpretation of all measurements at once. • The x-axis displays a given measurement and the height of each bar gives the number of measurements within the given region. • Histograms indicate the variability of the data and are useful for determining if a measurement falls outside of “specification”.
For a large number of experiment replicates the results approach an ideal smooth curve called theGAUSSIAN or NORMAL DISTRIBUTION CURVE Characterised by: The mean value –x gives the center of the distribution The standard deviation – s measures the width of the distribution
“Sum of” Individual measurement Number of measurements Average • The most basic statistical tool to analyze a series of measurements is the average or mean value : The average of the three values 10, 15and 12.5 is given by:
Deviation Deviation = individual value – avg value Need to calculate an average or “standard” deviation To eliminate the possibility of a zero deviation, we square di
Standard Deviation • The average amount that each measurement deviates from the average is called standard deviation (s) and is calculated for a small number of measurements as: Sum of deviation squared xi = each measurement = average n = number of measurements Note this is called root mean square: square root of the mean of the squares
Standard Deviation For example, calculate the standard deviation of the following measurements: 10, 15 and 12.5 (avg = 12.5) The values deviate on average plus or minus 2.5 :12.5 ± 2.5 10.0 12.5 15.0
Other ways of expressing the precision of the data: • Variance Variance = s2 • Relative standard deviation • Percent RSD or Coefficient of Variation (CV)
Standard Deviation of the Mean The uncertainty in the best measurement is given by the standard deviation of the mean (SDOM)
Gaussian Distribution • Given a set of repeated measurements which have random error. • For the set of measurements there is a mean value. • If the deviation from the mean for all the measurements follows a Gaussian probability distribution, they will form a “bell-curve” centered on the mean value. • Sets of data which follow this distribution are said to have a normal (statistical) distribution of random data.