Download
1 / 33
330 likes | 494 Views
From netCDF to GIS. David R. Maidment Unidata Program Center, Boulder CO 6 Feb 2004. NetCDF and GIS. NetCDF describes atmospheric and water properties varying continuously in (x,y,z,t) GIS describes the physical landscape,

E N D
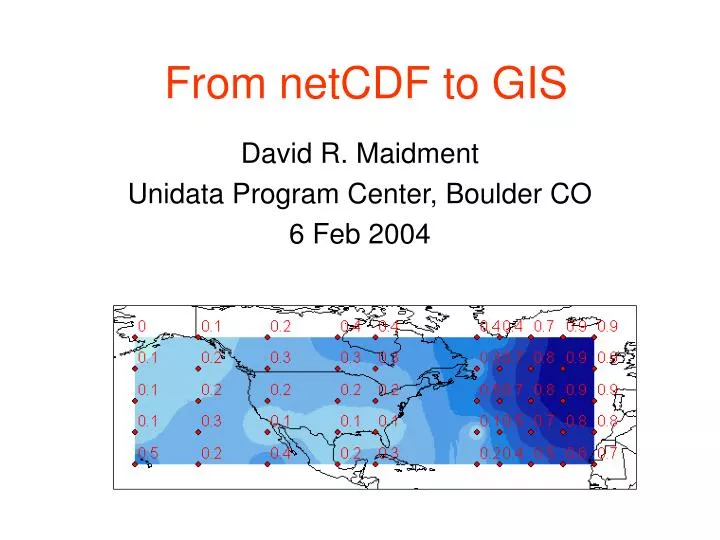
From netCDF to GIS David R. Maidment Unidata Program Center, Boulder CO 6 Feb 2004
NetCDF and GIS • NetCDF describes atmospheric and water properties varying continuously in (x,y,z,t) • GIS describes the physical landscape, • Vector GIS has spatially discrete features (point, line area) • Raster GIS is spatially continuous (in 2D) • How do we connect the “water” with the “water environment”
NetCDF File for Model Output dimensions: lat = 5, lon = 10, level = 4, time = unlimited; variables: float rh (time, lat, lon); int lat(lat), lon(lon); lat:units = “degrees_north”; long:units = “degrees_east”; short time(time); time:units = “hours since 1996-1-1”; data: lat = 20, 30, 40, 50, 60; long = -160, -140, -118, -96, -84, -52, -45, -35, -25, -15; time = 12; rh = .5,.2,.4,.2,.3,.2,.4,.5,.6,.7, .1,.3,.1,.1,.1.,.1,.5,.7,.8,.8, .1,.2,.2,.2,.2,.5,.7,.8,.9,.9, .1,.2,.3,.3,.3,.3,.7,.8,.9,.9 .0,.1,.2,.4,.4,.4,.4,.7,.8,.9;
Interpolate to Raster GeoTiff format, cell size = 0.5º
Average Rh in each State Determined using Spatial Analyst function Zonal Statistics with Rh as underlying raster and States as zones
Unidata Toolbox Relative Humidity Analysis Model Created in Arc 9 Model Builder
Model Output Geodatabase (Grids) Geodatabase Feature Dataset Feature class Feature class Raster Catalog Relationship Raster Table Table
Scenarios for Data Dissemination • ArcSDE and ArcIMS • Leveraging the LDM • Access through VisAD • Direct downloads from ArcGIS
Scenario 1: ArcIMS & ArcSDE • Underlying data are stored in a relational database (e.g. Oracle) • Accessed through Arc Spatial Data Engine (ArcSDE) • Web access through Arc Internet Map Server (ArcIMS) • Used for National Elevation Dataset, National Land Cover Dataset, National Hydrography Dataset • Suitable for large static databases • Possibly a good approach for historical climate datasets, e.g. VEMAP (NCAR: Nan Rosenbloom, Dave Schimel, Tim Kittel) National Elevation Dataset
Scenario 1: ArcIMS & ArcSDE • User Experience • Go to a web site, browse available data and select a geographic region and desired data themes • “Download” means that a data product is created off-line and user is notified by email when it is ready • If < 100MB download via ftp for free • If > 100MB write to CD-ROM and mail ($$) • Contacts:Paul Wiese, USGS, Denver (NHD); Sue Greenlee, USGS, EROS Data Center (NED, NLCD) National Elevation Dataset
Scenario 2: Leverage the LDM • File is disseminated through LDM network e.g. netCDF format • Unidata publishes an Arc Toolbox for converting file (or adds a decoder to LDM to convert to Grid) • Good for GIS analysis of existing real time data stream
Scenario 3: Access through VisAD • VisAD is used to browse remote datasets • Protocol to access Geography Network is added to VisAD • Geographic data added to VisAD displays • Atmospheric data converted to GeoTIFF for GIS analysis • Build Raster Catalog of atmospheric datasets Data Publisher 1 Data Publisher 4 Data Publisher 2 Data Publisher 3 Meteorologix publishes atmospheric data on the Geography Network
Scenario 4: Direct Downloads from ArcGIS • Select region and time period • Launch query to http:// access • Download data • Import to geodatabase • Run models Nexrad data for July 30, 2001, Rosillo Creek
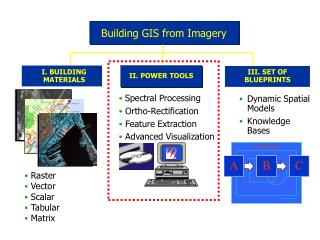
Bringing together these two communities by using a common geospatial data model CRWR GIS CRWR GIS in Water Resources Consortium Water Resources
Arc Hydro Framework Data Model
Arc Hydro Framework For South Florida Basins Waterbody (NHD) Hydro Points National Hydrography Dataset, NHD
Drainage System Hydro Network Flow Time Time Series Hydrography Channel System Arc Hydro Components
Connecting Arc Hydro and Hydrologic Models GIS Interfacedata models HMS Geo Database Arc Hydro data model RAS WRAP
FLOODPLAIN MAP Nexrad Map to Flood Map in Arc 9 Model Builder Flood map as output Model for flood flow HMS Model for flood depth Nexrad rainfall map as input
Variable Time Time and Space in GIS Time Series Feature Series t3 t2 Value t1 Time Attribute Series Raster Series Value t3 t2 t1 t1 t2 t3 y x
Variable Time t1 t2 t3 Time Series and Temporal Geoprocessing DHI Time Series Manager Time Series Feature Series t3 t2 Value t1 Time Attribute Series Raster Series Value t3 t2 t1 y x ArcGIS Temporal Geoprocessing
Time series from gages in Kissimmee Flood Plain • 21 gages measuring water surface elevation • Data telemetered to central site using SCADA system • Edited and compiled daily stage data stored in corporate time series database called dbHydro • Time series downloaded from dbHydro and stored for all gages as Arc Hydro Attribute Series
Arc Hydro Attribute Series Map features have a time varying attribute HydroID 2906 Feature Class (HydroID) Attribute Series Table (FeatureID)
Raster Series Ponded Water Depth Kissimmee River June 1, 2003
Arc Hydro Attribute Series Object TSDateTime Feature Class (point, line, area) TSValue FeatureID TSType TSType Table
NetCDF Data Model Time Dimensions and Coordinates Value Space (x,y,z) Variable Attributes
Conclusions • Good time to make progress • Unidata THREDDS research done at Unidata and some experience accumulated • Arc 9.0 is about to be released with Model Builder; planning for Arc 9.1 about to begin • Fairly sound understanding of how to develop time series in ArcGIS • Lots of cool weather and climate data that we really, really would like to use more!!

![netCDF Operators [NCO]](https://cdn0.slideserve.com/623950/netcdf-operators-nco-dt.jpg)