Download
1 / 58
590 likes | 810 Views
Advanced Methods of Data Analysis. Course on Microarray Data Acquisition and Analysis Weizmann Institute of Science 16 May 2007 Presented by Tal Shay & Yuval Tabach Weizmann Institute of Science Rehovot, Israel. 9:00 - 10:00 CTWC 10:00 - 11:00 CTWC exercise 11:00 – 11:30 Break

E N D
Advanced Methods of Data Analysis Course on Microarray Data Acquisition and Analysis Weizmann Institute of Science 16 May 2007 Presented by Tal Shay & Yuval Tabach Weizmann Institute of Science Rehovot, Israel • 9:00 - 10:00 CTWC • 10:00 - 11:00 CTWC exercise • 11:00 – 11:30 Break • 11:30 - 12:00 SPIN • 12:00 - 13:00 SPIN exercise
Coupled Two-Way Clustering CTWC Course on Microarray Data Acquisition and Analysis Weizmann Institute of Science 16 May 2007 Presented by Tal Shay & Yuval Tabach Weizmann Institute of Science Rehovot, Israel • Gad Getz, Erel Levine, and Eytan Domany • Coupled two-way clustering analysis of gene microarray dataPNAS 97: 12079-12084
Talk Aim Guide how to use the CTWC server to properly analyze micro-array data.
Motivation • Micro-array experiments generate millions of numbers containing • a lot of biological information. • The problem: Very complicated data contain large amount of noise. • How to unravel the biological information which is masked • by a mess of irrelevant information. • CTWC is a simple heuristic clustering procedure that was • developed especially to cope with micro-array data.
Talk Outline • Preprocessing and filtering • Clustering of Genes and Conditions • Super-Paramagnetic Clustering (SPC) • Coupled Two-Way Clustering (CTWC) • CTWC server • Exercise
Gene Expression Matrix – CTWC format The DB_NAME is used to link genes to a database
Visualization of Expression Matrix • Column = chip (=sample) • Row = probeset • Color = expression level genes samples
Preprocessing • Select variable genes • Standardize genes samples Initial Expression Matrix
Preprocessing • Select variable genes • Standardize genes samples 1000 probesets with highest standard deviation
Preprocessing • Select variable genes • Standardize genes samples 1000 probesets with highest standard deviation, standardized
Talk Outline • Preprocessing and filtering • Clustering of Genes and Conditions • Super-Paramagnetic Clustering (SPC) • Coupled Two-Way Clustering (CTWC) • CTWC server • Exercise
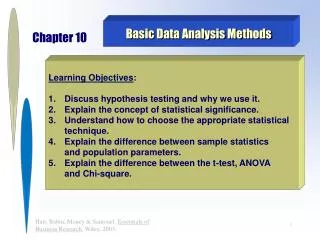
What questions can we ask? Supervised Methods Hypothesis Testing(use predefined labels) • Which genes are expressed differently in two known types of samples? • What is the minimal set of genes needed to distinguish one type of samples from the others? • Which genes behave similarly in the experiments? • How many different types of samples are there? Unsupervised MethodsExploratory Analysis(use only the data)
Clustering – unsupervised analysis samples Low variation genes All genes genes High variation genes Filtering 1 Clustering 3 clusters, each contains highly correlated genes 2 3
Unsupervised Analysis • Goal A:Find groups of genes that have correlated expression profiles.These genes are believed to belong to the same biological process and might be co-regulated.Learn on the biology, infer function • Goal B:Divide conditions to groups with similar gene expression profiles.Examples: Find sub-types of a disease, group or drugs according to their effect Clustering Methods
Dendrogram1 How many clusters we have ? The answer depends on the resolution CLUSTER ANALYSIS YIELDS DENDROGRAM T (RESOLUTION)
BUT WHAT ABOUT THE OKAPI? Giraffe + Okapi
Clustering problem definition • Input: N data points, Xi, i=1,2,…,N in a D dimensional space. • Goal: Find “natural” groups (clusters) of points. Points that belong to the same cluster – are “more similar”
Clustering is not well defined • Similarity: which points should be considered close? • Clustering method: • Resolution: specify/hierarchical results • Shape of clusters: general, spherical.
Agglomerative Hierarchical Clustering • Results depend on distance update method • Single Linkage: elongated clusters • Average Linkage: sphere-like clusters • Greedy iterative process • NOT robust against noise • Not always finds the “natural” clusters.
Stop … think • We want to identify the real (“natural”) clusters. • We should have a reliability parameter that will help us to distinguish between significant and non-significant clusters.
Talk Outline • Preprocessing and filtering • Clustering of Genes and Conditions • Super-Paramagnetic Clustering (SPC) • Coupled Two-Way Clustering (CTWC) • CTWC server • Exercise
Super-Paramagnetic Clustering (SPC)M.Blatt, S.Weisman and E.Domany (1996) Neural Computation • The idea behind SPC is based on the physical properties of dilute magnets. • Calculating correlation between magnet orientations atdifferent temperatures (T). Small elements, Spins T=Low
Super-Paramagnetic Clustering (SPC)M.Blatt, S.Weisman and E.Domany (1996) Neural Computation • The idea behind SPC is based on the physical properties of dilute magnets. • Calculating correlation between magnet orientations atdifferent temperatures (T). T=High
Super-Paramagnetic Clustering (SPC)M.Blatt, S.Weisman and E.Domany (1996) Neural Computation • The idea behind SPC is based on the physical properties of dilute magnets. • Calculating correlation between magnet orientations atdifferent temperatures (T). T=Intermediate
T=High T=Low T=Intermediate Phases of the Inhomogeneous Potts Ferromagnet Ferro Super-Para Para
Super-Paramagnetic Clustering (SPC) T=Low T=Low T=Intermediate T=High
Super-Paramagnetic Clustering (SPC) • The algorithm simulates the magnets behavior at a range of temperatures and decides which interactions to break. • The temperature (T) controls the resolution Example: N=4800 points in D=2
Advantages of SPC • Scans all resolutions (T) • Robust against noise and initialization -calculates collective correlations. • Identifies “natural” and stable clusters (T) • No need to pre-specify number of clusters • Clusters can be any shape
Inside SPC: dendrogam and stable clusters Min Cluster Size: 3 Stable Delta T: 14 Ignore dropout: 1 T 28 26 24 22 10
Genes Samples CTWC server - Setting the SPC parameters
Talk Outline • Preprocessing and filtering • Clustering of Genes and Conditions • Super-Paramagnetic Clustering (SPC) • Coupled Two-Way Clustering (CTWC) • CTWC server • Exercise
Back to gene expression data • 2 Goals: Cluster Genes and Conditions • 2 independent clustering: • Genes represented as vectors of expression in all conditions • Conditions are represented as vectors of expression of all genes
First clustering - Experiments 1. Identify tissue classes (tumor/normal) D = 2000
Second Clustering - Genes 2.Find Differentiating And Correlated Genes D = 62 genes samples
Two-way clustering S1(G1) G1(S1) TWO-WAY CLUSTERING:
Two way clustering-ordered TWO-WAY CLUSTERING: S1(G1) G1(S1)
Football Song A Song B
Coupled Two-Way Clustering (CTWC)G. Getz, E. Levine and E. Domany (2000) PNAS • Philosophy: Only a small subset of genes play a role in a particular biological process; the other genes introduce noise, which may mask the signal of the important players. Only a subset of the samples exhibit the expression patterns of interest. • New Goal: Use subsets of genes to study subsets of samples (and vice versa) • A non-trivial task – exponential number of subsets. • CTWC is a heuristic to solve this problem.
Inside CTWC: Iterations Two-way clustering
CTWC server -Setting the coupled two-way clustering parameters E-mail notification
tissues 1 G4 G12 COUPLED TWO-WAY CLUSTERING OF COLON CANCER: TISSUES S1(G4) S1(G12)
CTWC colon cancer - tissues Tumor Normal S17 Protocol A Protocol B COUPLED TWO-WAY CLUSTERING OF COLON CANCER: TISSUES S1(G4) S1(G12)
colon cancer carcinoma +adenoma What kind of results do you wish to find ? type A /type B distance matrix
Talk Outline • Preprocessing and filtering • Clustering of Genes and Conditions • Super-Paramagnetic Clustering (SPC) • Coupled Two-Way Clustering (CTWC) • CTWC server • Exercise
CTWC software • Web interface • ctwc.weizmann.ac.il • ctwc.bioz.unibas.ch • Standalone • Write to Assif.Yitzhaky@weizmann.ac.il
#L1 in C #L1 in C |L1| |C1| Sample Labels • Given as a binary file • For a cluster Gx, label L with values L1 and L2: • Purity(C1, L1) – how much of C1 is composed of L1? • Efficiency(C1 , L1) – how much of L1 is contained in of C1?