Download
1 / 35
350 likes | 473 Views
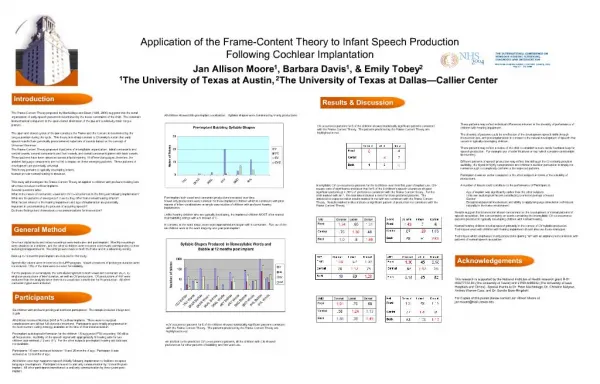
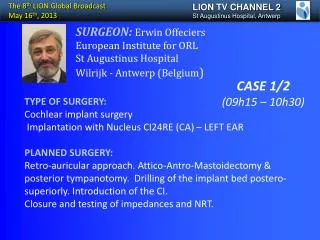
How to assess the audiological result of cochlear implantation. Paul J Govaerts, Bart Vaerenberg, Geert De Ceulaer, Kristin Daemers, Martine Coene The Eargroup & Univ Antwerp Antwerp - Belgium. Rationale. PTA = 57 dB. Sound features. Amplitude. intensity. Intensity coding. manner

E N D
How to assess the audiological resultof cochlear implantation Paul J Govaerts, Bart Vaerenberg, Geert De Ceulaer, Kristin Daemers, Martine Coene The Eargroup & UnivAntwerp Antwerp - Belgium
Rationale PTA = 57 dB
Sound features Amplitude intensity Intensity coding manner tempo rhythm syllabicity spectralcontent Spectral content Tonotopy Envelope Temporal content temporalcontent Temporal Fine Structure PhaseLocking pitch place voicing voice quality.
Sound processing identification discrimination detection red yellow
Sound processing identification discrimination detection
Sound processing identification discrimination detection
Measuring Outcome intensity spectralcontent temporalcontent
Measuring Outcome intensity spectralcontent temporalcontent
Measuring Outcome intensity spectralcontent temporalcontent
Replacing the cochlea intensity spectralcontent temporalcontent AuditorySpeech Sound Evaluation http://otoconsult.com
Rationale tooloud veryloud loud normal soft very soft inaudible
Use and interpretation P97,5 P2,5
Assessment of sound perception intensity spectralcontent temporalcontent
Assessment of sound perception ∆F0 F0=200 Hz 2008-’10 European consortium: Otoconsult (BE), Neurelec (FR), Del Bo Technologia per l’Ascolto (IT) Universities of Antwerp (BE), Leiden (NL), Venezia (IT), Bucharest (RO), Paris XIII (FR), CNRS (FR) intensity spectralcontent temporalcontent
Pitchperception ~ tonotopy ~ Tonotopy ~ Phase Locking ~ phaselocking ~ phaselocking
Pitchperception ~ Tonotopy ~ Phase Locking
Pitchperception: EAS (Digi Zebra) ~ Tonotopy ~ Phase Locking
Pitch perception: TFS (MedEl) ~ Tonotopy ~ Phase Locking
Pitchperception: Meniere ~ Tonotopy ~ Phase Locking
Localization Low F ∆t High F ∆I ITD: interaural time differences ILD: interaural level differences
I1 I2 Localization 0 -1 1 -2 2 -3 3 -4 4 -5 5 ΔI -6 6
14 mos 20 mos test 7 yrs Localization 1st CI 2nd CI 10 mos 5 yrs test 8 yrs
Measuring Outcome intensity spectralcontent temporalcontent
Measuring Outcome intensity spectralcontent temporalcontent
A§E self-testing OtoCube
Conclusions spectralcontent temporalcontent intensity RMS = -1/+1/+1.9 70% (14/20) JND: 8/94 AuditorySpeech Sound Evaluation http://otoconsult.com PTA = 57 dB