Download
1 / 37
370 likes | 608 Views
Network Ensembles (Committees) for Improved Classification and Regression. Radwan E. Abdel-Aal Computer Engineering Department November 2006. Contents. Data-based Predictive Modeling - Approach, advantages, Scope, and Main tools

E N D
Network Ensembles (Committees) for Improved Classification and Regression Radwan E. Abdel-Aal Computer Engineering Department November 2006
Contents • Data-based Predictive Modeling - Approach, advantages, Scope, and Main tools • Need for high prediction accuracy • The network ensemble (committee) approach - Need for diversity among members and How to achieve it • Some Results - Classification: Medical diagnosis - Regression: Electric peak load forecasting • Summary
Data-based Predictive Modeling • The process of creating a statistical model of future behavior based on data collected on observed past behavior • The model uses a number of predictors (input variables that are likely to influence the output) • The model relationship between such inputs and behavior is determined using a machine learning algorithm Input Vector, X (Predictors) (Attributes) (Features) Y = F(X) Output, Y
Advantages over other modeling approaches • Thorough theoretical knowledge is not necessary • Less user intervention (Let the data speak!) (No biases or pre-assumptions on relationships) • Better handling of nonlinearities, complexities • Greater tolerance to noise, uncertainties (Soft Computing) • Faster and easier to develop • Utilizes the loads of computerized historical data available now in many disciplines
Scope Environmental: - Pollution monitoring, Weather forecasting Finance and business: - Loan assessment, Fraud detection, Market forecasting - Basket analysis, Product targeting, Efficient mailing Engineering: - Process modeling and optimization, Load forecasting - Machine diagnostics, Predictive maintenance Medical and Bio Informatics - Screening, Diagnosis, Prognosis, Therapy, Gene classification Internet: - Web access analysis, Site personalization
How? Two basic steps Develop Model UsingKnown Cases Use Model For New Cases 1 2 Supervised Learning IN OUT IN OUT Known O/P, Y Unknown O/P, Y F(X) Attributes, X Rock Properties Attributes (X) Y = F(X) Determine F(X)
Data-based Predictive Modeling by supervised Machine learning • Database of solved examples (input-output) • Preparation: cleanup, transform, derive new attributes • Split data into a training and a test set • Training: Develop model on the training set • Evaluation: See how the model fares on the test set • Actual use: Use promising model on new input data to estimate unknown output
x F(x) ? G(x) Y Example: Medical Screening • Y=F(x): true function (usually not known) for population P • 1. Collect Data:“labeled” training sample drawn from P 57,M,195,0,125,95,39,25,0,1,0,0,0,1,0,0,0,0,0,0,1,1,0,0,0,0,0,0,0,00 78,M,160,1,130,100,37,40,1,0,0,0,1,0,1,1,1,0,0,0,0,0,0,0,0,0,0,0,0,01 69,F,180,0,115,85,40,22,0,0,0,0,0,1,0,0,0,0,1,0,0,0,0,0,0,0,0,0,0,0,00 18,M,165,0,110,80,41,30,0,0,0,0,1,0,0,0,0,0,0,0,0,0,0,0,0,0,0,0,0,01 • 2. Training: Get G(x); model learned from training sample, Goal: E<(F(x)-G(x))2> ≈ 0 for future samples drawn from P – Not just data fitting! • 3. Test/Use: 71,M,160,1,132,105,38,20,1,0,0,0,0,0,0,0,0,0,1,0,0,0,0,0,0,0,0,0,0?
Data-Based Modeling Tools(Learning Paradigms) • Decision Trees • Nearest-Neighbor Classifiers • Support Vector Machines • Neural Networks • Abductive Networks
S S S Neural Networks (NN) HiddenLayer Input Layer Output Layer Neurons .6 Age 34 Actual: 0.65 .4 .2 0.60 .5 .1 Gender 2 .2 .3 .8 .7 4 .2 Stage Error: 0.05 Transfer Function Weights Weights Dependent Output Variable Independent Input Variables (Attributes) Error back-propagation
x F(x) ? G(x) Y Limitations of Neural Networks • Ad hoc approach by user to determine network structure and training parameters- Trial & Error ? • Opacity or black-box nature gives poor explanation capabilities which are important, e.g. in medicine G(x) is ‘distributed’ in a maze of network weights x Y Significant inputs are not immediately obvious When to stop training to avoid over-fitting ? Local Minima may hinder optimum solution
Self-Organizing Abductive (Polynomial) Networks GMDH-based “Double” Element: y = w0 + w1 x1 + w2 x2 + w3 x12 + w4 x22 + w5 x1 x2 + w6 x13 + w7 x23 - Network of polynomial functional elements- not simple neurons - No fixed a priori model structure. Model evolves with training - Automatic selection of: Significant inputs, Network size, Element types, Connectivity, and Coefficients - Automatic stopping criteria, with simple control on complexity - Analytical input-output relationships
Need for high prediction accuracy:Medical Diagnosis - Ideally FN = FP = 0 - FN: Actual positives missed as negatives by classifier - FP: Actual negatives mistaken as positives by classifier Both types of errors are costly! “Cost” can be given to each type of error
Need for high prediction accuracy:Hourly Electric Load Forecasting Overestimation: Spin up reserve units unnecessarily Underestimation: Need to deploy expensive peaking units or buy costly generation from other utilities higher operating costs An extra 1% in forecast error increased operating cost of a UK power utility by 10 million sterling pounds in 1985
How to ensure good predictive models? • Use effective predictors • Use representative datasets for model training and evaluation • Large training and evaluation datasets • Pre-process datasets to remove outliers, errors, etc. and perform normalization, transformations, etc. • Avoid over-fitting during training (i.e. use parsimonious models) • Use proven learning algorithms
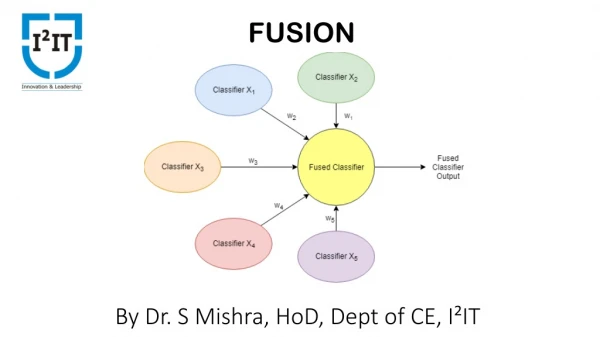
What if a single is not good enough? The Network Ensemble Approach If member networks are independent, diversity in the decision making process boosts generalization, thus improving accuracy, robustness, and reliability of the overall prediction Identical members No gain in performance Improvement expected only when members err in different ways and directions, so errors can cancel out! n is usually odd to suit majority voting
Methods of combining member outputs 1. Simple combination of member outputs: - Simple averaging of continuous outputs - Weighed averaging of continuous outputs (fixed weights) , where e.g. where is the variance of member i output on its training set - Majority voting of categorical outputs
Methods of combining member outputs, Contd. 2. A gating network uses the input vector to determine optimum weights for member outputs for each case to be classified 3. Stacked generalization approach: the output combiner is another higher-level network trained on the outputs of individual members to generate the committee classification output
Network Ensembles:The need for diversification The committee error can be shown to have two components: - One measuring the average generalization error of individual members - The other measuring the disagreement among outputs of individual members Therefore: • Individual members should ideally be uncorrelated or even negatively correlated (Diversity) • An ideal committee would consist of: • Highly accurate members, • which disagree among themselves as much as possible Possible tradeoffs between the above two requirements
Ensuring diversity: Committee of Experts Individual member networks belong to totally different learning paradigms, e.g. Neural networks, Nearest neighbor classifiers, Classification and Regression Trees (CART), etc. Advantages: • Members can use the same full training dataset and the same full set of input features No conflict between individual quality and collective diversity Disadvantages: • Requires the use of different tools and expertise
Ensuring diversity: Same learning paradigm Develop member networks with same paradigm using: • Different training subsets • or Different input features • or Different training conditions • Neural networks: - Different: architectures (MLP, RBF), algorithms (BP, SA) topologies, initial random weights, neuron transfer functions, learning rate, momentum, stopping criteria, (Research topic) • Abductive networks (Self organizing- Limited user choices!): - Different values for the model complexity parameter (CPM) Sacrifice individual quality for collective diversity!
CPM (Complexity Penalty Parameter: 0.1 to 10) Lower CPM More Complex Model Can be used as a method for ranking input features: Those selected earlier are better predictors
Some Results: Classification for Medical Diagnosis 1. The Pima Indians Diabetes Dataset from the UCI Machine Learning Repository • 768 cases: (669 for training and 99 for evaluation) • 8 numerical attributes on physiological measurements and medical test results • A binary class variable (Diabetic:1, Not Diabetic: 0) • Percentage of positives in the total set: 34.9% • Typical classification accuracies reported for C4.5 decision tree tool: 74.6%
Classification of the Diabetes Dataset • Optimum monolithic abductive network model using full training dataset and feature set • Two abductive network ensemble approaches: • A: 3 members trained on the same (full) training set at different CPM values (model complexity parameters) (NT = 669 cases) • B: 3 members trained on 3 mutually exclusives subsets of the training set at same CPM value (NT = 223 cases)
Ensemble-B Ensemble-A Members trained on same training data and Different CPMs Members trained on different training data and same CPMs Errors by different members are poorly correlated (i.e. err differently, more independent) Errors by different members are highly correlated (i.e. err together, less independent)
Classification of the Diabetes Dataset Monolithic Ensemble-A Ensemble-B
Some Results: Classification for Medical Diagnosis 2. The Cleveland Heart Disease Dataset from the UCI Machine Learning Repository • 270 cases: (190 for training and 80 for evaluation) • 13 numerical attributes • A binary class variable: Presence 1/Absence 0 of heart disease • Percentage of positives in the total set: 44.4 % • Typical classification accuracies reported with neural networks: 81.8%
Classification of the Heart Disease Dataset • Optimum monolithic abductive network model using full training dataset and feature set • 3-member abductive network ensemble: • Training set available is small Not practical to split • For diversity: Members trained on thesame (full) training set but using different (mutually exclusive) subsets of input features
Classification of the Heart Disease Dataset • To ensure good (and uniform) quality of all member networks, good quality input features must be distributed uniformly amongst members • First, rank the input feature subset based on predictive quality • Then distribute the features on the 3 members fairly
Weekend Weekdays Some Results: Regression:Electrical Load Forecasting • Short term: Hours, a week • Medium term: Months, a year • Long term: Up to 20 years Short term (ST) Forecasting: - Hourly load profile - Daily peak load () ST Forecasts useful for scheduling: Generator unit commitment Short-term maintenance Fuel allocation Evaluating interchange transactions in deregulated markets
Weekend General upward trend Weekdays Seasonal yearly variations 28 years Short-Term Forecasting: Factors affecting the load • Time, Calendar: Hourly, daily, seasonal, holidays, school year, … • Weather: (Heating/cooling loads) Temperature, humidity, wind speed, cloud cover, … Economic, Societal: (Slow trending effect)Industrial growth,electricity pricing,Population growth,… • Events: Start/stop of large loads: Sports and TV shows, …
Forecasting tomorrow’s Peak Load • 47 Inputs representing: - Peak load, - Max and min temperatures, - Day type: WRK, SAT, SUN/HOLIDAY over the previous 7 days and the forecasted day • Training: 3 years (1987-89) Evaluation: 4th year (1990) • Trend management (2 ways): - Use an additional trend input - Normalize all training years to last training year and then denormalize model output 24 off Tomorrow’s Peak Load Forecaster 7 x 6 = 42 O/P Forecasted Day 5 Trend Total: 48 inputs
Forecasting tomorrow’s Peak Load: Monolithic neural and abductive Networks Abductive Model: Only 8 of the 48 inputs available are automatically selected during training Predicted Forecasted Actual Actual, MW MAPE: 2.61% 2.52% Performance over evaluation year: • Mean Absolute Percentage Error (MAPE) = 2.52% • Correlation cofft. between true and predicted data = 0.986
Improving Forecasting Accuracy Using Abductive Ensembles • Three-member ensemble to forecast load for the year 1990 Training: • Members are trained on raw data for the three preceding years 1987, 1988, 1989 • No need for trend input when training on 1-year data For evaluation: • For each model: • Normalize evaluation year load data to the model training year at input • Denormalize model output to evaluation year before combining the 3 outputs Evaluation Year
Abductive Network EnsemblesResults Statistically significant error reduction
Summary • Network ensembles (committees) can lead to significant performance gains in classification and regression • Members need to be both accurate and independent • Independence is more difficult to achieve with abductive compared to neural networks • Effective ways to achieve this are: Different training datasets, different input features, and different model complexity (CPMs) • Demonstrated the technique on medical data (classification) and electrical load forecasting (regression)