Download
1 / 39
410 likes | 676 Views
SDSS Quasar Science. as told by Gordon Richards (Drexel University). With thanks to the members of the Quasar Working Group, particularly Don Schneider, Xiaohui Fan, Michael Strauss, Pat Hall, Dan Vanden Berk , Sebastian Jester, and Scott Anderson, also Adam Myers. Survey Properties.

E N D
SDSS Quasar Science as told by Gordon Richards (Drexel University) With thanks to the members of the Quasar Working Group, particularly Don Schneider, Xiaohui Fan, Michael Strauss, Pat Hall, Dan VandenBerk, Sebastian Jester, and Scott Anderson, also Adam Myers
Survey Properties • 100,000 quasars in 7470 sq. deg. of spectroscopy (DR7; Schneider et al. 2009) • i=19.1 for z<3; i=20.2 for z>3 • <z>=1.5 • ~50 with z>5 (zmax=5.41) • ~1,000,000 photometric quasars in 8417 sq. deg. of imaging (Richards et al. 2008) • up to 95% classification accuracy • photo-z’s accurate to 0.3 80% of the time.
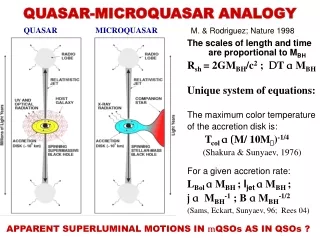
Quasar Definition • “An actively accreting super-massive black hole found in the centers a massive galaxy” • Quasar = QSO = Active Galactic Nucleus = AGN (Urry & Padovani 1995)
Some History • Schmidt (1963, Nature, 197, 1040) Quasars “discovered”; 3C 273 z=0.16 (t=-2Gyr) • Greenstein & Matthews (1963, Nature, 197,1041) 3C 48 z=0.37 (t=-4Gyr) • Before SDSS, z=4.897 (PC 1247+3406; SSG91) • z=5 in 1999 (t<10%; SDSSp J0338+0021; Fan et al.) • z=6 in 2001 (t<1Gyr; SDSS J1030+0524; Fan et al.) • z=6.43 in 2003 (SDSS J1148+5251; Fan et al.) • Current record holder, z=6.43 (Willott et al. 2007; CFHQS J2329-0301)
Some History • Schmidt (1963, Nature, 197, 1040) Quasars “discovered”; 3C 273 z=0.16 (t=-2Gyr) • Greenstein & Matthews (1963, Nature, 197,1041) 3C 48 z=0.37 (t=-4Gyr) • Before SDSS, z=4.897 (PC 1247+3406; SSG91) • z=5 in 1999 (t<10%; SDSSp J0338+0021; Fan et al.) • z=6 in 2001 (t<1Gyr; SDSS J1030+0524; Fan et al.) • z=6.41(Willot et al. 2003) SDSS J1148+525 • Current record holder, z=6.43 (Willott et al. 2007; CFHQS J2329-0301)
The Gunn-Peterson (1965) Effect Lyα CIV Lyβ 3C 9 z=2.01 Density of neutral hydrogen (from absorption) lower than expected. Lots of hydrogen gas in the Universe; it should absorb most of the photons blueward of 1216 Angstroms. The spectrum should really look like this. Universe became re-ionized between z=1100 and z=2?
Searching for the Epoch of Re-ionization The z>6 SDSS quasars show the expected GP absorption trough. Combining results from WMAP suggest that there may even have been 2 epochs of re-ionization. See the review by Fan, Carilli, & Keating (2006, ARAA) Becker et al. 2001
Quasar Evolution z~6 composite • The intrinsic properties of quasars have changed relatively little over cosmic time. Ly a Low-z composite NV OI SiIV Ly a forest Fan et al. 2004, 2008 Vignali et al. 2005; Shemmer et al. 2005
Quasar Evolution • Quasar themselves may not have evolved much over time. • But their space density has. • SDSS sample first to probe all redshifts at once. t=1/2 Richards et al. 2006
Quasar Evolution: Cosmic Downsizing Hasinger et al. 2005 • Even this picture has changed radically in the past 10 years. • Cowie et al. 1996 “cosmic downsizing”. • First seen in AGNs in Ueda et al. 2003. Ueda et al. 2003
Quasar Evolution: Cosmic Downsizing • Can’t see in the optical due to lack of dynamic range in luminosity. Hasinger et al. 2005
Downsizing in the Optical • First robust evidence of cosmic downsizing of quasars in the optical to be presented by Croom et al. (2008) • Part of the joint SDSS+2dF (2SLAQ) effort Croom et al. 2008
Quasars and Cosmic Downsizing • Much work has been done on “downsizing” in the context of galaxies. • Let’s look at how quasars fit in. • Previously: galaxy and quasar people lived in different worlds. • Today: • Most massive galaxies host supermassiveBHs • Have gone through a quasar phase
The MBH-sigma Relation Massive black holes co-evolve with their host galaxies. (Tremaine et al. 2002; also Ferrarese & Merritt 2000; Gebhardt et al. 2000; Magorrian et al. 1998)
Soltan (1982) Argument • The current black hole mass density roughly matches that expected from accretion in quasars over cosmic time (assuming ~10% efficiency). Yu & Tremaine 2002; Shankar, Weinberg & Miralda-Escude 2007
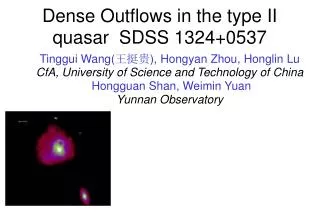
Type 2 (Obscured) Quasars • Thought to exist for a long time • By symmetry arguments with Sy1/Sy2 • To explain the X-ray background. • First large samples came from the SDSS (Zakamska et al.) Type 1 Composite (VandenBerk et al. 2001) Type 2 Composite (Zakamska et al. 2003)
Luminosity Dependent Obscuration? • The obscured fraction appears to be dependent on luminosity (ranges from 1:1 to 4:1) • Luminous quasars: ~1/3 each are unobscured, self-obscured, host-obscured (Polletta et al. 2008) Reyes et al. 2008 Ueda et al. 2003
Quasar Clustering • Some of the most powerful results come from clustering anlyses. • Quasars are more clustered on small scales than large scales. • Comparing with models of dark matter clustering gives the “bias” (overdensity of galaxies to DM) • Linear bias (bQ=1) ruled out at high significance. Myers et al. 2007
Clustering Results Ross et al. 2008 • Quasars more strongly clustered at high-z • Contrary to a hierarchical merger scenario with quasars at the high density peaks Ross et al. (2008) Shen et al. 2007 Myers et al. 2007a
Quasars Have ~Constant Mass? • Can turn estimates of bQinto mass of the DM halos hosting quasars. • Find very little evolution in halo mass with redshift. • Mean halo mass 3-8x10¹²h-1MSun(Myers et al. 2007; Croomet al. 2005; Porcianiet al. 2004). • Shen: extends to z=4 Myers et al. 2007
What We (Used To) Expect • Galaxies (and their DM halos) grow through hierarchical mergers • Quasars inhabit rarer high-density peaks • If quasars long lived, their BHs grow with cosmic time • MBH-σ relation implies that the most luminous quasars are in the most massive halos. • More luminous quasars should be more strongly clustered (b/c sample higher mass peaks).
What We Get • Galaxies (and their DM halos) grow through hierarchical mergers, but with “cosmic downsizing” • Quasars always turn on in potential wells of a certain size (at earlier times these correspond to relatively higher density peaks). • Quasars turn off on timescales shorter than hierarchical merger times, are always seen in similar mass halos (on average). • MBH-σ relation then implies that quasars trace similar mass black holes (on average) • Thus little luminosity dependence to quasar clustering (L depends on accretion rate more than mass). • Observed range of luminosity is thus due to a range of accretion rates and not mass.
Merger Scenario w/ Feedback • Merge gas-rich galaxies, forming buried quasars, feedback expels the gas, revealing the quasar and eventually shutting down accretion. • Feedback from: jets, radiation, accretion disk winds Hopkins et al. 2005
Clouds (and Torus?) => Disk Winds Elvis 2000 Urry & Padovani 1995 Proga 2005
Emission Lines as Wind Diagnostics • Disk winds are thought to be the reason why the broad lines are single peaked (Murray et al. 1995) • Investigating line properties as a function of luminosity, color, etc. tell us something about the inner structure of the quasar. Richards et al. 2002
Broad Absorption Line Quasars • Similarly, quasars with P-Cygni like absorption troughs reveal much about the nature of the accretion disk wind. • Weak X-ray (relative to UV) allows stronger winds. P Cygni profile from ejected gas Hall et al. ‘02; Reichard et al. ‘03a,b; Tolea et al. ‘03; Trump et al. ‘06; Gibson et al. ‘08
Quasars: Products of their Environment “The two necessary ingredients … are a massive black hole and an abundant fuel supply … The combination is rare today, but evidently was not so at high redshift.” (Kauffmann et al. 2003)
The Future • As much good quasar science remains to be done with the SDSS data as has already been done. • Stripe 82 holds much promise as a pre-LSST data set. • As multi-wavelength coverage in the SDSS area grows, so will the science.
The Future: Efficient Target Selection + Photo-z’s Current selection techniques for quasars are inefficient in the optical (~50-80% success rate) and in the infrared. It takes MUCH longer to take spectra than to get photometry. More efficient (~95%) selection algorithms coupled with accurate photometric redshift techniques can make spectroscopy nearly obsolete.
red Traditional Quasar Selection M z < 2.2 quasars F z > 3 quasars A blue blue red
How Can We Do Better? Non-Parametric Bayesian Classification with Kernel Density Estimation (aka NBCKDE) Richards et al. 2004, ApJS, Efficient Photometric Selection of Quasars from the SDSS: 100,000 Quasars from DR1, 155, 257 Richards et al. 2009a, ApJS, in press
Given two training sets, Here quasarsand stars (non-quasars), and an unknown object, which class is more likely?
Quasar Photo-z z=1.5 u g r i z
Photometric Redshifts Photometric redshifts are 80% accurate to within 0.3 Richards et al. 2001 Weinstein, Richards et al. 2004
Quasar Clustering • Some of the most powerful results come from clustering anlyses. • Quasars are more clustered on small scales than large scales. • Comparing with models of dark matter clustering gives the “bias” (overdensity of galaxies to DM) • Linear bias (bQ=1) ruled out at high significance. Myers et al. 2007
Conclusions Our understanding of quasars has changed radically over the past ~15 years Large imaging surveys have played a much bigger role in these changes than the planners of those surveys ever imagined.