Download
1 / 1
20 likes | 231 Views
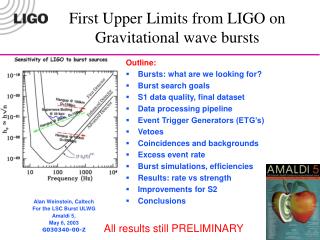
Strain (RMS). Frequency (Hz). H β =- 3 [strain 2 Hz -1 ]. Upper Limit Map of a Stochastic Gravitational Wave Background. Stefan W. Ballmer, California Institute of Technology, for the LIGO Scientific Collaboration. Directional Upper Limit on GW Back ground

E N D
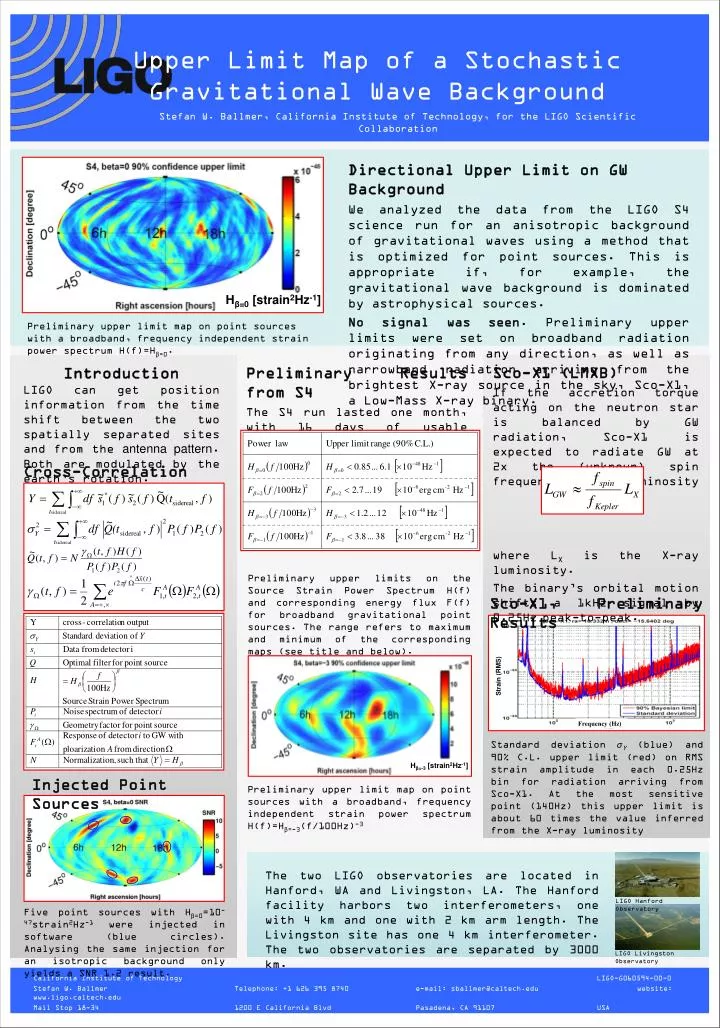
Strain (RMS) Frequency (Hz) Hβ=-3 [strain2Hz-1] Upper Limit Map of a StochasticGravitational Wave Background Stefan W. Ballmer, California Institute of Technology, for the LIGO Scientific Collaboration Directional Upper Limit on GW Background We analyzed the data from the LIGO S4 science run for an anisotropic background of gravitationalwaves using a method that is optimized for point sources. This isappropriate if, forexample, the gravitational wave background is dominated by astrophysical sources. No signal wasseen. Preliminary upper limits were set on broadband radiation originating from any direction, as well as narrowband radiation arriving from the brightest X-ray source in the sky, Sco-X1, a Low-Mass X-ray binary. Hβ=0 [strain2Hz-1] Preliminary upper limit map on point sources with a broadband, frequency independent strain power spectrum H(f)=Hβ=0. Sco-X1 (LMXB) If the accretion torque acting on the neutron star is balanced by GW radiation, Sco-X1 is expected to radiate GW at 2x the (unknown) spin frequency with a luminositywhere LX is the X-ray luminosity. The binary’s orbital motion shifts a 1kHz signal by 0.25Hzpeak-to-peak. Preliminary Results from S4 The S4 run lasted one month, with 16 days of usable coincidence data. IntroductionLIGO can get position information from the time shift between the two spatially separated sites and from the antenna pattern. Both are modulated by the earth’s rotation. Cross-Correlation Preliminary upper limits on the Source Strain Power Spectrum H(f) and corresponding energy flux F(f) for broadband gravitational point sources. The range refers to maximum and minimum of the corresponding maps (see title and below). Sco-X1, Preliminary Results Standard deviation σY (blue) and 90% C.L. upper limit (red) on RMS strain amplitude in each 0.25Hz bin for radiation arriving from Sco-X1. At the most sensitive point (140Hz) this upper limit is about 60 times the value inferred from the X-ray luminosity Injected Point Sources Preliminary upper limit map on point sources with a broadband, frequency independent strain power spectrum H(f)=Hβ=-3(f/100Hz)-3 The two LIGO observatories are located in Hanford, WA and Livingston, LA. The Hanford facility harbors two interferometers, one with 4 km and one with 2 km arm length. The Livingston site has one 4 km interferometer. The two observatories are separated by 3000 km. LIGO Hanford Observatory Five point sources with Hβ=0=10-47strain2Hz-1 were injected in software (blue circles). Analysing the same injection for an isotropic background only yields a SNR 1.2 result. LIGO Livingston Observatory California Institute of Technology LIGO-G060594-00-0 Stefan W. Ballmer Telephone: +1 626 395 8740 e-mail: sballmer@caltech.edu website: www.ligo.caltech.edu Mail Stop 18-34 1200 E California Blvd Pasadena, CA 91107 USA