Download
1 / 1
10 likes | 75 Views
Supplementary Figure 1. A. B. Kaplan-Meier analysis of progression from the age of islet autoantibody development to type 1 diabetes in islet autoantibody postive children.

E N D
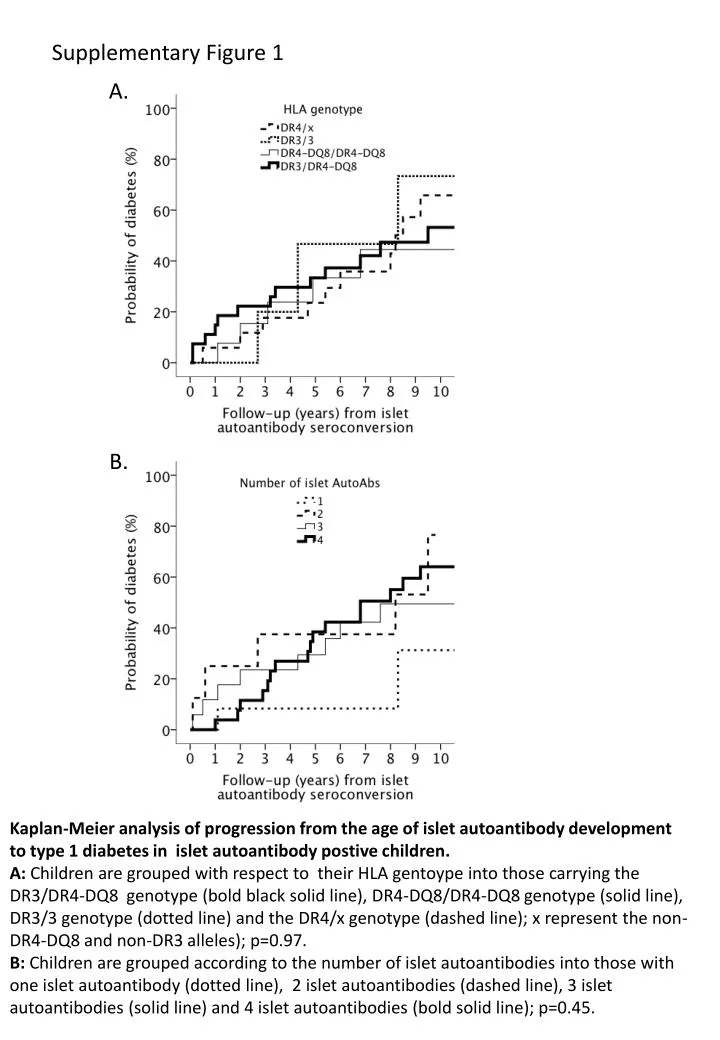
Supplementary Figure 1 A. B. Kaplan-Meier analysis of progression from the age of islet autoantibody development to type 1 diabetes in islet autoantibody postivechildren. A: Children are grouped with respect to their HLA gentoype into those carrying the DR3/DR4-DQ8 genotype (bold black solid line), DR4-DQ8/DR4-DQ8 genotype (solid line), DR3/3 genotype (dotted line) and the DR4/x genotype (dashed line); x represent the non-DR4-DQ8 and non-DR3 alleles); p=0.97. B: Children are grouped according to the number of islet autoantibodies into those with one islet autoantibody (dotted line), 2 islet autoantibodies (dashed line), 3 islet autoantibodies (solid line) and 4 islet autoantibodies (bold solid line); p=0.45.