Download
1 / 29
290 likes | 447 Views
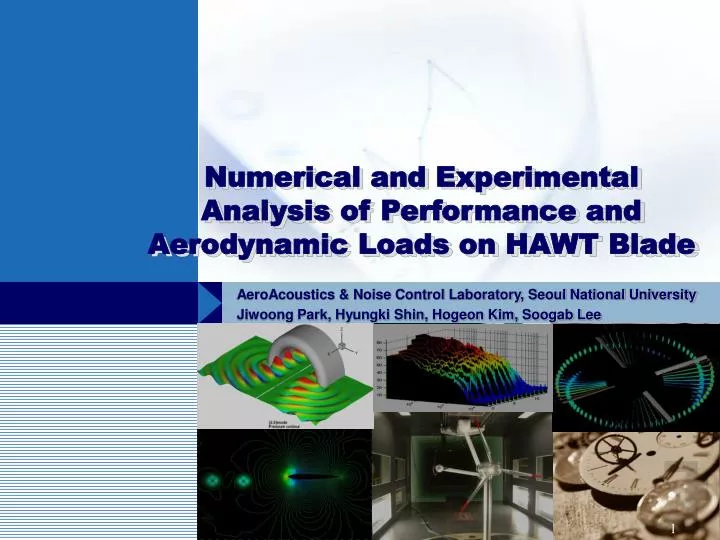
Numerical and Experimental Analysis of Performance and Aerodynamic Loads on HAWT Blade. AeroAcoustics & Noise Control Laboratory, Seoul National University Jiwoong Park, Hyungki Shin, Hogeon Kim, Soogab Lee. Introduction. Numerical Method. Experimental Method. Results & Analysis.

E N D
Numerical and Experimental Analysis of Performance and Aerodynamic Loads on HAWT Blade AeroAcoustics & Noise Control Laboratory, Seoul National University Jiwoong Park, Hyungki Shin, Hogeon Kim, Soogab Lee
Introduction Numerical Method Experimental Method Results & Analysis Concluding Remarks Contents
Introduction • Curved vortex • NREL TEST • SNU TEST • FVE Wake Model Wind Tunnel Test Free Wake Analysis Analysis & Validation
Numerical models • Vortex wake model • ‘engineering models’ based on vortex methods • solved velocity potential expressed by Laplace Eqn. • application of Biot-Savart law • Free wake model or prescribed wake model • currently proper model to solve aerodynamic loading • added 3-d adjustment at stall region
Free Wake model Circulation CVC (Constant Vorticity Contour) Wake Structure Vortex sheet trailing from the interval (ra,rb) is replaced by a single vortex filament of constant strength Ref. NASA Contractor Report 177611
Free Wake Model • Schematic of FVE before vortex filaments hit the tower vortex filaments strike against the tower separated into vortex ring and horse-shoe vortices Finite Vortex Element Free wake model
Free Wake model NREL test model FVE free wake model
based on a shape function and local solidity • derived through correlation with prop-rotor and helicopter test • based on the analysis of three-dimensional integral laminar boundary layer equations • Delayed Stall Angle • Shape function STALL DELAY MODEL Corrigan Stall delay model Du & Selig Stall delay model • Corrected Aerodynamic Coefficient
Flow Chart Loop all azimuth angle input geometry & operating condition Calculate effective angle of attack at each blade section Calculate velocity field Calculate axial & radial induction factor by BEMT to apply initial downwash move free wake & check wake-tower interaction NO YES Effective AOA > 2D stall AOA Convergence criterion satisfied? Calculate initial circulation distribution & wake geometry Calculate blade loading based on circulation strength Apply stall delay model to 2d table Calculate circulation distribution Regenerate wake release point based on new circulation distribution Calculate blade loading based on airfoil data Apply 2d drag data to blade loading Output result data NO YES pre-processor Main-processor post-processor
NREL Wind Tunnel Test • Wind Turbine Stall regulated type 2 Blades type Blade Radius : 5.03m • Reynolds no. 700,000~3,300,000 • Measurement Shaft Torque Root Bending Moment Blade Surface Pressure • NASA AMES WIND TUNNEL Test section : 25m 36m
SNU Wind Tunnel Test • Wind Turbine 1:50 Scale model of 750kW WT 3 Blades type Blade Radius : 0.53m 1.225 m • Measurement Shaft Torque Velocity fluctuation by Hot-wire • Reynolds no. 70,000~130,000 • KAFA WIND TUNNEL Test section : 2.45m 3.5m
Wake Analysis Tip vortex movement Tip Vortex Measurement by Hot Wire Probe Ref. TU-Delft wind tunnel test Butterworth 5th order filter Average of 3 Revolution Raw data Filtered data
Wake Analysis Tip vortex location V dV Measurement points time Tip vortex Trajectory dV r/R r/R x/R Tip Vortex Measurement by Hot Wire Probe
Wake Analysis Validation of FVE Free Wake model • SNU model • FVE Free wake vs measured trajectory Measurement data of SNU model FVE free wake geometry
Wake Analysis 13m/s, TSR=6.5 13m/s, TSR=6.0 Validation of FVE Free Wake model • Wind speed : 13m/s 13m/s, TSR=6.0, Yaw 10 deg. Wake geometry( TSR = 6.5, 6.0 ) Yawed flow case(10deg)
Wake Analysis Wind speed = 13m/s Wind speed = 15m/s Tip Vortex Pitch Angle • SNU model • FVE Free wake VS measured data
Load Analysis (Head-on Flow Case)
Comparison of predictions to NREL measurement data Wake Geometry and Normal force distribution of NREL BLADE • FVE Wake Model • 13m/s, TSR=3.0 Circulation and Normal force distribution Wake geometry
Comparison of predictions to NREL measurement data Shaft Torque • FVE Free wake model • apply stall delay model 3000 2500 2000 1500 1000 Torque (Nm) 500 0 5 10 15 20 25 -500 -1000 wind speed (m/s) NREL free wake with 2d table free wake with Corrigan stall delay model free wake with Du & Selig stall delay model
Comparison of predictions to NREL measurement data Normal Force Coefficient
Comparison of predictions to SNU measurement data Wake Geometry & Cn distribution of SNU BLADE • Curved Vortex vs FVE Wake Model • 14 m/s, TSR=5.5 Curved vortex FVE Free Wake Wake Geometry Cn distributions
Comparison of predictions to SNU measurement data Shaft Torque Comparison • Curved Vortex vs FVE Wake Model • 14 m/s, TSR=5.5 Shaft Torque Distribution
Load Analysis (Yawed Flow Case)
Comparison of predictions to NREL measurement data Wake Geometry of NREL BLADE • Curved Vortex vs FVE Wake Model • 15 m/s, TSR=2.6 • Yaw angle : 30 degree Curved vortex FVE Free Wake
Comparison of predictions to NREL measurement data Normal Force Coefficient distribution • 15 m/s, TSR=2.6 • Yaw angle : 30 degree r/R = 0.47 r/R = 0.3 r/R = 0.63 r/R = 0.80
Comparison of predictions to SNU measurement data Wake Geometry & Cn distribution of SNU BLADE • Curved Vortex vs FVE Wake Model • 14 m/s, TSR=5.5 • Yaw angle : 30 degree • Curved Vortex vs FVE Wake Model • 14 m/s, TSR=5.5 • Yaw angle : 10 degree FVE Free Wake Curved vortex FVE Free Wake Curved vortex
Comparison of predictions to SNU measurement data Shaft Torque Comparison • SNU Model • Yawed Flow • TSR=5.5
Concluding Remarks Wake Analysis • FVE free wake model is devised and validated • Wake shape shows good agreement with measured geometry Load Analysis • Validated by NREL and SNU model • Importance of the Wake-Tower interaction • Effectiveness of FVE free wake model Future work • Refine free-wake model • Dynamic stall delay model • Aero-elastic model • Noise prediction model